It’s moments like this when technical indicators can provide very valuable insights. Glancing at a quick chart or a statistical data set can be enormously enlightening. The current short-term technicals could be a reason for some concern here as we are reaching unprecedented levels according to some indicators. When markets make extreme movements we often enter brief periods of statistical anomaly.
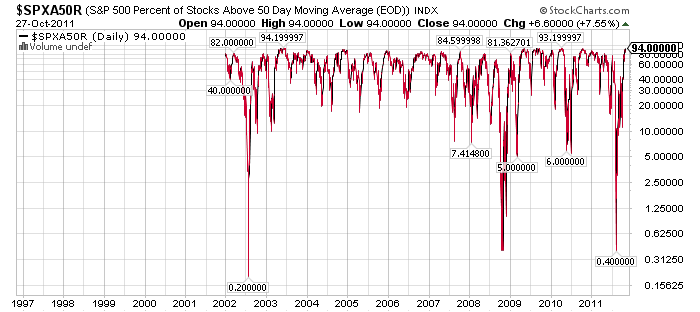
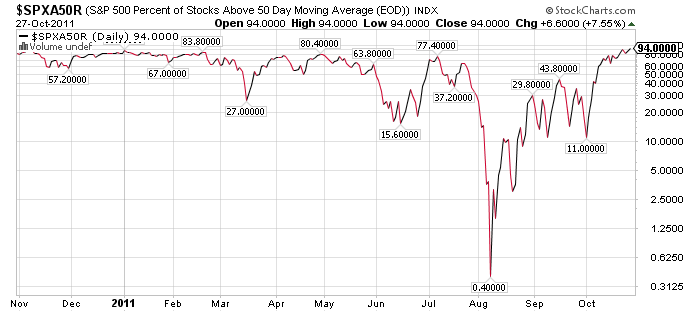
The current cause for some concern is the market’s extraordinary overbought conditions based on some metrics. The most eye opening of which is the % of S&P 500 stocks above their 50 day moving average. The current reading of 94% has been registered just once in the last 10 years. I’ve provided both long-term and short-term charts below:


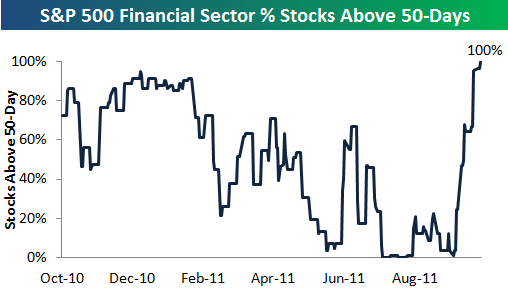
On Friday Bespoke Investments noted the even more extreme situation in financials. 100% of the S&P 500 financial sector is now trading above its 50 day moving average:

If you’re a believer in mean reversion you have to start wondering if the recent rally hasn’t been overdone. Granted, this is just one indicator out of the hundreds that investors should follow, but rare data points such as the above are always worth noting….
Source: StockCharts.com
Mr. Roche is the Founder and Chief Investment Officer of Discipline Funds.Discipline Funds is a low fee financial advisory firm with a focus on helping people be more disciplined with their finances.
He is also the author of Pragmatic Capitalism: What Every Investor Needs to Understand About Money and Finance, Understanding the Modern Monetary System and Understanding Modern Portfolio Construction.

Comments are closed.