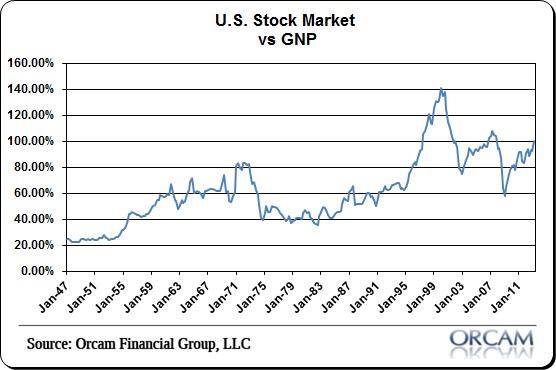
For the first time since the recovery began, Warren Buffett’s favorite valuation metric has breached the 100% level. That, of course, is the Wilshire 5,000 total market cap index relative to GNP. See the chart below for historical reference.
I only point this out because it’s a rather unusual occurrence and the recent move has been fairly sizable. It happened during the stock market bubble of the late 90’s, but then occurred again just briefly during the 2006-2007 period when the valuation broke the 100% range in Q3 2006 and stayed above that range for about a year. We all know what followed the 2007 peak in stock prices.
Here we are in this wonderful new world where everyone values nominal stock prices more than they value the actual output that underlies it. If this indicator isn’t a sign that we are still residing in this Fed driven asset targeting mania then I don’t know what is.
To me, the whole thinking is backwards and more disruptive than anything else, but the party must go on. Lord knows the Fed isn’t taking the punch bowl away any time soon. So drink up. Maybe you’ll get so drunk you’ll sleep through the inevitable bad parts when they arrive.
Chart via Orcam Investment Research:
Mr. Roche is the Founder and Chief Investment Officer of Discipline Funds.Discipline Funds is a low fee financial advisory firm with a focus on helping people be more disciplined with their finances.
He is also the author of Pragmatic Capitalism: What Every Investor Needs to Understand About Money and Finance, Understanding the Modern Monetary System and Understanding Modern Portfolio Construction.


Comments are closed.