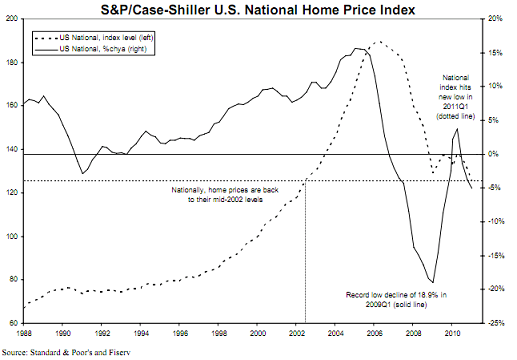
This morning’s Case Shiller housing data confirmed that the double dip is officially here. This should come as no surprise as real-time trackers of this data have long predicted this. Case Shiller reports:
“This month’s report is marked by the confirmation of a double-dip in home prices across much of the nation. The National Index, the 20-City Composite and 12 MSAs all hit new lows with data reported through March 2011. The National Index fell 4.2% over the first quarter alone, and is down 5.1% compared to its year-ago level. Home prices continue on their downward spiral with no relief in sight.” says David M. Blitzer, Chairman of the Index Committee at S&P Indices. “Since December 2010, we have found an increasing number of markets posting new lows. In March 2011, 12 cities – Atlanta, Charlotte, Chicago, Cleveland, Detroit, Las Vegas, Miami, Minneapolis, New York, Phoenix, Portland (OR) and Tampa – fell to their lowest levels as measured by the current housing cycle. Washington D.C. was the only MSA displaying positive trends with an annual growth rate of +4.3% and a 1.1% increase from its February level.
“The rebound in prices seen in 2009 and 2010 was largely due to the first-time home buyers tax credit. Excluding the results of that policy, there has been no recovery or even stabilization in home prices during or after the recent recession. Further, while last year saw signs of an economic recovery, the most recent data do not point to renewed gains.
 In April 2010 I described why this scenario was likely to unfold:
“As I said above, the most likely scenario is the “work-out”. Government stimulus continues to bolster the private sector in the back half of 2010, but the lack of direct aid in housing begins to weigh on the housing market in the second half of 2010. Negative seasonal trends make for a very difficult H2 in housing and a tough start in 2011. The economy appears fairly strong into the latter portion of 2010, but the dwindling stimulus ultimately pressures the private sector. Demand for housing remains tepid as job growth is weak, the unemployment rate remains above 8% into 2011 and the negative inventory trends prove too much for the real estate market to overcome. Ultimately, prices decline 7%-15% over the course of the coming 2.5 years.”
Prices are down 5%+ year over year so we’re officially into the double dip, however, it’s not over yet. This alone will have the Fed very concerned. If you’ll recall, the credit crisis was a housing crisis. This data should have the Fed on the path to accommodation for the foreseeable future. The banking system, as a result of this data, is likely to remain very fragile.
S&P estimates that the damage to the banking system from a double dip will amount to at least $70-$80B in losses. Via S&P & Research recap:
“If a double-dip in housing of the magnitude we’ve imagined were to ensue over the next few quarters, rising foreclosures and delinquencies, combined with a higher volume of home modifications and redefaults, would potentially drive credit losses higher by $30 billion to $35 billion.
This would result in a five-year cumulative credit loss rate of 8.5% to 9% range in banks’ housing portfolios, approximately 0.5 to 1 percentage point higher than in our baseline forecast. Separately, a buildup of representation and warranty expense might increase costs by an estimated $33 billion. Another $6 billion to $12 billion in fee income might be foregone due to fewer originations.
Overall, we estimate that total cumulative loan losses to the U.S. banking sector from these risks could increase by $70 billion to $80 billion relative to a more benign baseline.”
Don’t expect the Fed to change their policy stance any time soon with this housing debacle going on. And we should all hope they don’t resort to QE3 – it’s now looking like QE2 did less than nothing….
Mr. Roche is the Founder and Chief Investment Officer of Discipline Funds.Discipline Funds is a low fee financial advisory firm with a focus on helping people be more disciplined with their finances.
He is also the author of Pragmatic Capitalism: What Every Investor Needs to Understand About Money and Finance, Understanding the Modern Monetary System and Understanding Modern Portfolio Construction.

Comments are closed.