
I’ve made a big fuss over QE in recent years and yet the market continues to plough higher. I often have people ask me:
“Why does QE make stock prices go higher if there’s no fundamental impact?”
My answer is always the same. First, look at Europe where QE has also been implemented and stock markets like Greece, Italy and Spain have been decimated. Then look at a country like the USA where QE has been implemented and yet stocks soar. Then ask yourself what the big difference is between these countries? The answer: austerity versus massive deficit spending.
It might be easy to scoff at such an observation, but the reality of the picture is that corporate profits have been largely driven by the deficit in this cycle. As net investment collapsed the traditional driver of profits was overtaken by government spending (see figure 1). This makes sense if you’re familiar with Kalecki and his profits equation. It makes even more sense if you’d been working under Richard Koo’s balance sheet recession theory in recent years. The impact of government deficit spending in such an environment has been massive. All those people screaming about the ill effects of deficit spending and hyperinflation in recent years missed the very explainable and fundamental driver of the profits momentum.
This doesn’t mean QE did nothing (I think it helped to some degree), but it doesn’t mean it was the primary driver of the recovery by any means. In fact, the risk of QE is the disequilirbium I often talk of where market become disjointed when compared to profits. And when people ask me if QE is resulting in some disequilibrium, I often tell them that it hasn’t necessarily resulted in that outcome yet. But with stocks rising nearly every day and soon outpacing the trajectory of corporate profits (see figure 2) there’s no reason to think that we can’t reach a level of disequilibrium in the next few years (or maybe even less).
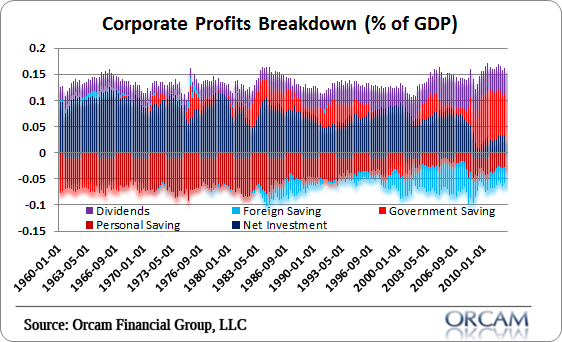
(Figure 1 – Corporate Profits Breakdown via Orcam Investment Research)
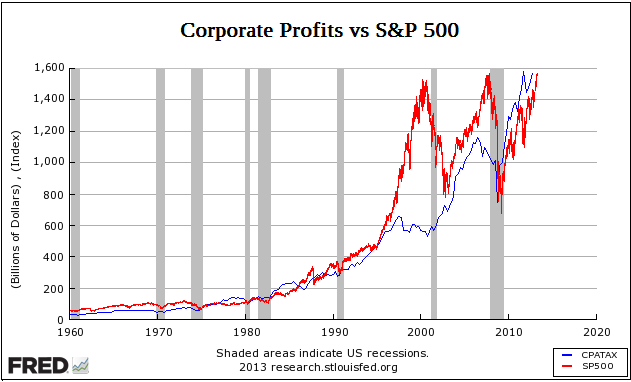
(Figure 2 – Corporate Profits vs S&P 500)
Mr. Roche is the Founder and Chief Investment Officer of Discipline Funds.Discipline Funds is a low fee financial advisory firm with a focus on helping people be more disciplined with their finances.
He is also the author of Pragmatic Capitalism: What Every Investor Needs to Understand About Money and Finance, Understanding the Modern Monetary System and Understanding Modern Portfolio Construction.
Comments are closed.