Lots of good commentary from Jeff Saut’s weekly letter.
On dollar cost averaging:
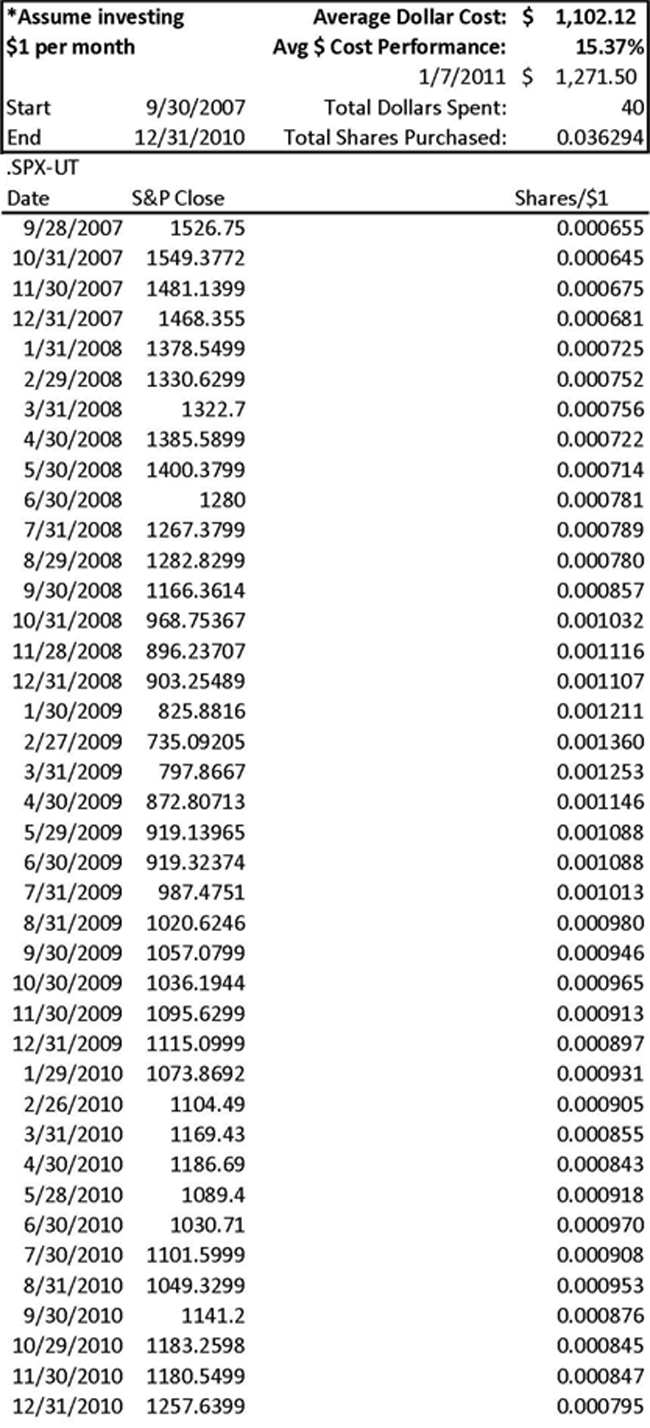
“I had a very interesting request from one of our Financial Advisors (FAs) last week. He asked me, “Jeff, have you heard of anyone who has gone through the exercise to see what would have happened if you dollar cost averaged every month from the October 2007 stock market high until now?” “Wow,” I responded, “That’s a really good question and not all that hard to check.” Recall that dollar cost averaging is an investment strategy whereby participants invest equal amounts of money over specific time periods, say $100 monthly, in a particular investment. That strategy allows investors to buy more shares when prices are low and fewer shares when prices are high. With that concept in mind, we begin. On October 11, 2007, the S&P 500 recorded an intraday high of 1576.09. Seventeen months later it would bottom with an intraday low on March 6, 2009, of 666.79. In 2010, the S&P 500 closed out the year at a December 31 price of 1257.64 and currently changes hands around 1283 (SPX/1283.35). Hence, if an investor began buying $1’s worth of the SPX at the end of September 2007, and continued to purchase $1’s worth of the SPX at the end of each month until yearend 2010, the dollar cost averaged performance is ~15.4% (excluding commissions) over that 40-month period (see the nearby chart). This compares to roughly an 18% loss over the same time frame for the investor who “rode it out” with no dollar cost averaging. That’s a whopping 33% out-performance if our fictional investor had been able to conquer his fear and had employed a dollar cost averaging strategy. Regrettably, there’s the “rub.””
On fear and greed:
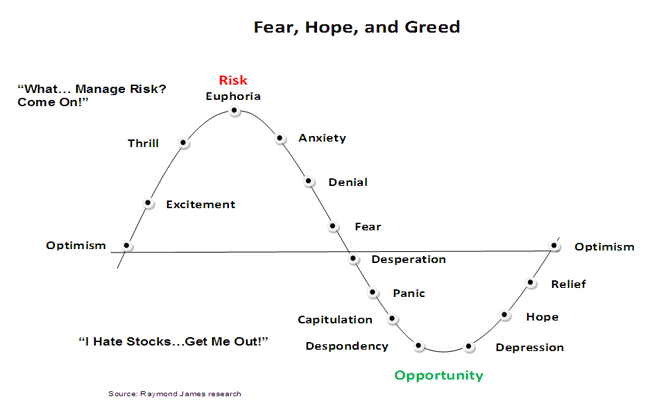
“Ladies and gentlemen, while it’s true over the long term that it is all about earnings, in the short to intermediate term the stock market is fear, hope and greed only loosely connected to the business cycle. This Fear, Hope and Greed cycle can be seen in the attendant chart. Beginning at the lower left of the chart we have Optimism with the chart rising to Excitement, Thrill and Euphoria where the bullish psychological environment peaks and turns down. You can liken this ascending pattern to what occurred following the Long Term Capital Management, and Russian default, back in 1998. Said debacles pressured the SPX from its July 1998 high of ~1167 into its Despondency low of ~957 in October of that year. At those lows, Fear reigned supreme. From there, however, stocks bottomed and traveled higher into their late 2000 highs, accompanied by the aforementioned ascent into the Euphoria region. Subsequently, stocks peaked and turned down. Over the next two years the SPX would shed some 49% of its value causing investors’ mindsets to travel down the other side of our psychological chart (Anxiety, Denial, Fear, Depression, Panic Capitulation, and Despondency) with the SPX bottoming in October 2002. At that point investors were despondent; ergo, they were liquidating their stock portfolios just in time for stocks to bottom and begin a rally that would again cause investors’ psyches to rise into the stock market’s October 2007 peak.”
On waiting for the “fat pitch”:
“Sometimes me sits and thinks and sometimes me just sits. Currently, me just sits, believing the evidence for a pullback is mounting. In addition to the aforementioned warning flags, since September 1, 2010, every time the Russell 2000 (RUT/773.18) has closed below its 20-day moving average (DMA), buyers have showed up the very next day. Not so last week. In fact, last week was the first down week for the SPX in eight weeks as the divergences in the stock market continue to grow (the DJIA was the only major index to register a new high on Friday; most of the other averages peaked on Tuesday). As legendary Dow Theorist Robert Rhea observed, mounting divergences suggest stocks are being distributed (read: sold) by smart money. In conclusion, it is worth considering that my notes indicate there is a tendency for the equity markets to “top” coincident with the State of the Union address (Tuesday night). Consistent with these thoughts, I am currently “just sitting;” or as Warren Buffett is fond of saying, “In this game the market has to keep pitching, but you don’t have to swing. You can stand there with the bat on your shoulder for six months until you get a fat pitch.””
You can read the full letter here. As always, Mr. Saut’s commentary is a must read.
Source: Raymond James
Mr. Roche is the Founder and Chief Investment Officer of Discipline Funds.Discipline Funds is a low fee financial advisory firm with a focus on helping people be more disciplined with their finances.
He is also the author of Pragmatic Capitalism: What Every Investor Needs to Understand About Money and Finance, Understanding the Modern Monetary System and Understanding Modern Portfolio Construction.


Comments are closed.