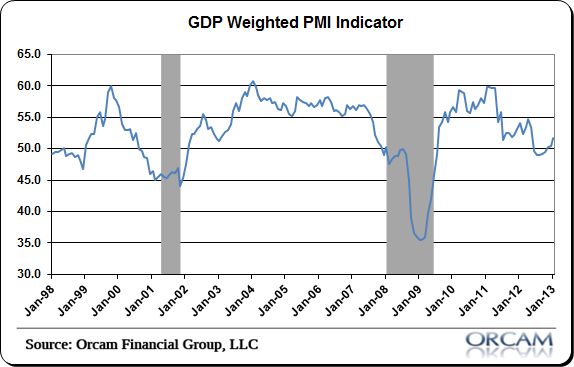
With all the global PMI reports in the books we can better gauge the health of the global economy. The January data was overwhelmingly positive. The January globally weighted PMI comes in at 51.8, up from 50.5 in December. The biggest improvements came from the Eurozone, USA, China, Japan and Brazil. There was some deterioration in India, but the country remained well in the contraction range over 50.
All in all, this points to a healthier global economy and a clear move back into the expansionary period after the 2012 dip into contraction range. Here’s a brief breakdown of some of the more important components:
- Eurozone: 47.9, UP from 46.1.
- USA: 55.8, UP from 54.
- China: 52.3, UP from 51.5.
- India: 53.2, DOWN from 54.7.
- Japan: 47.7, UP from 45
- Russia: 52, UP from 50.
- Brazil: 53.2, UP from 51.1.
 (Chart via Orcam Group)
Mr. Roche is the Founder and Chief Investment Officer of Discipline Funds.Discipline Funds is a low fee financial advisory firm with a focus on helping people be more disciplined with their finances.
He is also the author of Pragmatic Capitalism: What Every Investor Needs to Understand About Money and Finance, Understanding the Modern Monetary System and Understanding Modern Portfolio Construction.

Comments are closed.