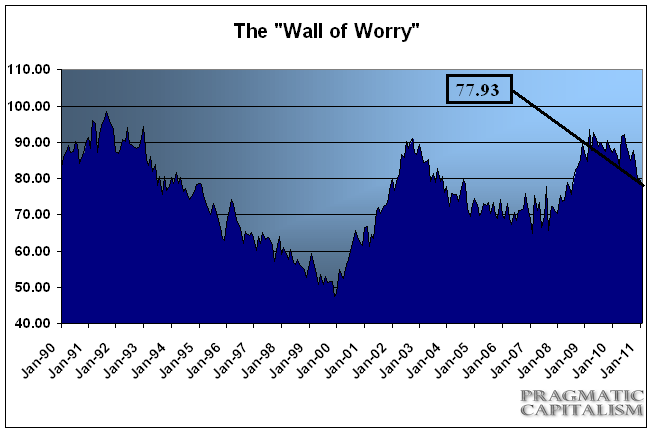
While many short-term indicators point to complacency in the markets the Wall of Worry indicator still points to a healthy level of skepticism with regards to the bull market. The Wall of Worry, which accounts for the level of worry in the market by taking the inverse summation of a series of long-term sentiment indicators, declined in February to 77.93 from January’s reading of 79.43. This is down substantially from the 4th quarter of 2010 and is consistent with the rapid rise in market optimism. This level, however, is still consistent with a relatively high level of skepticism in the market and reflects a belief that the rally in stocks is likely unsustainable.
The latest reading is well off the highs of 93.5 in March 2009, however, is also well off the lows seen in past cycles. This long-term indicator is currently consistent with levels that occurred closer to the beginning of the last two bull markets than the end. During the 2003-2007 bull market this indicator first declined t0 current levels in January 2004. During the 1990’s bull market the Wall of Worry indicator first touched current levels in July of 1993. If the market truly does climb a wall of worry it’s safe to say that the current wall of worry remains relatively high.

Mr. Roche is the Founder and Chief Investment Officer of Discipline Funds.Discipline Funds is a low fee financial advisory firm with a focus on helping people be more disciplined with their finances.
He is also the author of Pragmatic Capitalism: What Every Investor Needs to Understand About Money and Finance, Understanding the Modern Monetary System and Understanding Modern Portfolio Construction.

Comments are closed.