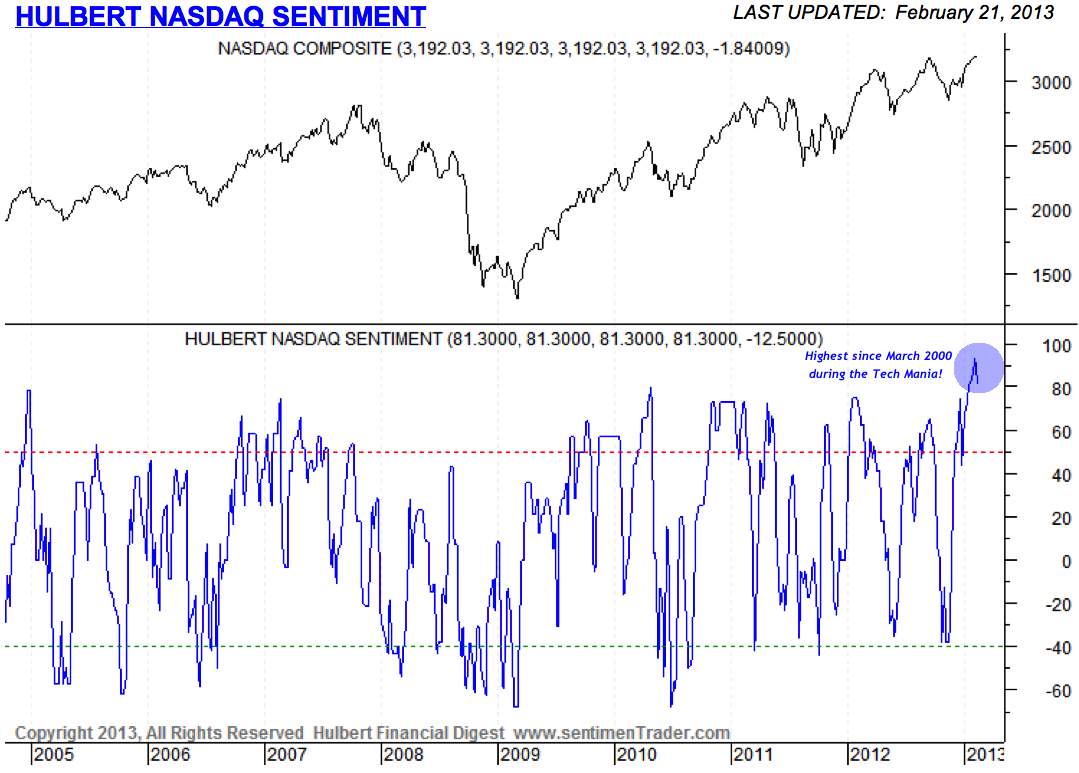
You might have thought that Monday’s slide in the equity market wiped out quite a bit of the euphoria in the markets. If so, you’d be wrong based on the Hulbert Nasdaq Sentiment Index which is still at its highest level since March 2000:
Via Short Side of Long:
What I find even more intriguing than all the technical mumbo jumbo I just wrote about, is that just about everyone is not expecting the outcome laid out in this post. Mark Hulbert runs a great service called Financial Digest, which tracks the opinions and recommendations of various newsletter advisors for the Nasdaq. Just like any other contrarian indicator, when the Hulbert Nasdaq Sentiment shows the majority of “gurus” holding net short exposure it usually means its the time to buy and visa versa. Chart 3 shows that the current readings were above 90% net long exposure, which is one of the most bullish readings since March 2000 (the month the Tech Stock bubble burst). With just about everyone positioning themselves for higher prices, what could possibly go wrong? It is truly rare to find anyone out there expecting a bear market, that is for sure.
Mr. Roche is the Founder and Chief Investment Officer of Discipline Funds.Discipline Funds is a low fee financial advisory firm with a focus on helping people be more disciplined with their finances.
He is also the author of Pragmatic Capitalism: What Every Investor Needs to Understand About Money and Finance, Understanding the Modern Monetary System and Understanding Modern Portfolio Construction.


Comments are closed.