
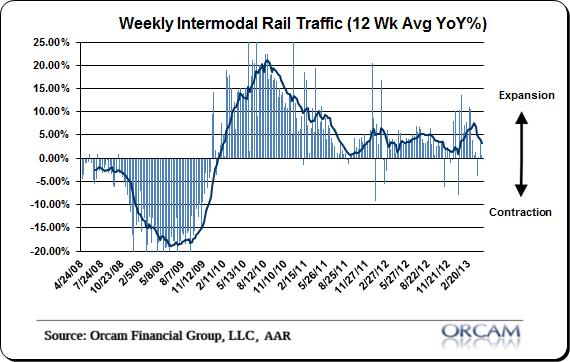
After a big first quarter rail traffic has come out of the gate extremely soft in Q2. The average pace of year over year expansion in intermodal traffic was a very healthy 5.3% in Q1, but has averaged just 0.08% so far in the first 4 weeks of the second quarter. This is a trend that has been developing since early March as the pace of expansion has averaged just 2.11% since the first week of March. Overall, that brings the 12 week moving average to 4.01%. That’s still a healthy pace, but the recent slowing is a trend worth keeping a close eye on. If rail traffic is any indicator it’s possible that economic growth peaked in Q1.
Here’s more from AAR:
“The Association of American Railroads (AAR) reported mixed traffic for the week ending April 20, 2013, with total U.S. weekly carloads of 276,662 carloads, down 2 percent compared with the same week last year. Intermodal volume for the week totaled 240,698 units, up 0.6 percent compared with the same week last year. Total U.S. traffic for the week was 517,360 carloads and intermodal units, down 0.8 percent compared with the same week last year.
Four of the 10 carload commodity groups posted increases compared with the same week in 2012, led by petroleum and petroleum products, up 40.1 percent. Commodities showing a decrease included grain, down 21.8 percent.
For the first 16 weeks of 2013, U.S. railroads reported cumulative volume of 4,403,958 carloads, down 2.3 percent from the same point last year, and 3,799,366 intermodal units, up 4.6 percent from last year. Total U.S. traffic for the first 16 weeks of 2013 was 8,203,324 carloads and intermodal units, up 0.7 percent from last year.”
Chart via Orcam Investment Research:
Mr. Roche is the Founder and Chief Investment Officer of Discipline Funds.Discipline Funds is a low fee financial advisory firm with a focus on helping people be more disciplined with their finances.
He is also the author of Pragmatic Capitalism: What Every Investor Needs to Understand About Money and Finance, Understanding the Modern Monetary System and Understanding Modern Portfolio Construction.
Comments are closed.