
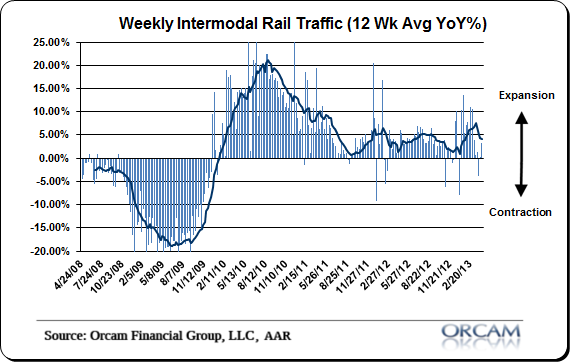
Recent rail trends have weakened substantially from very strong levels earlier this year. The latest weekly reading came in at 3.3% year over year, but continues a trend of low single digit readings. This latest data brings the 12 week average to 4.4%. That’s still a healthy level, but well off the March high of 3.6%. In this environment I guess any growth is good growth so this has to go down as a moderate positive for the economy even though the trend is negative.
Here’s more via AAR:
The Association of American Railroads (AAR) reported mixed traffic for the week ending April 13, 2013, with total U.S. weekly carloads of 275,675 carloads, down 0.6 percent compared with the same week last year. Intermodal volume for the week totaled 241,987 units, up 3.3 percent compared with the same week last year. Total U.S. traffic for the week was 517,662 carloads and intermodal units, up 1.2 percent compared with the same week last year.
Four of the 10 carload commodity groups posted increases compared with the same week in 2012, including petroleum and petroleum products, up 51.2 percent, and motor vehicles and parts, up 10.9 percent. Commodities showing a decrease included metallic ores, down 13.8 percent, and grain, down 12.1 percent.
For the first 15 weeks of 2013, U.S. railroads reported cumulative volume of 4,127,296 carloads, down 2.4 percent from the same point last year, and 3,558,668 intermodal units, up 4.9 percent from last year. Total U.S. traffic for the first 15 weeks of 2013 was 7,685,964 carloads and intermodal units, up 0.8 percent from last year.
Chart via Orcam Investment Research:
Mr. Roche is the Founder and Chief Investment Officer of Discipline Funds.Discipline Funds is a low fee financial advisory firm with a focus on helping people be more disciplined with their finances.
He is also the author of Pragmatic Capitalism: What Every Investor Needs to Understand About Money and Finance, Understanding the Modern Monetary System and Understanding Modern Portfolio Construction.
Comments are closed.