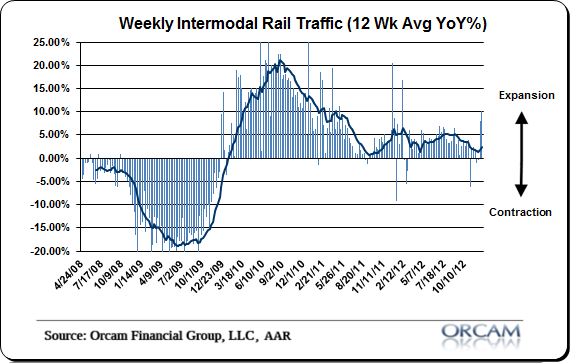
The first reading on rail traffic showed a modest decline to -0.1%. The beginning of the year is usually a volatile period for rail traffic trends so it’s better to take a bit longer view here. The 12 moving moving average remains modestly positive at 2.23%. That’s consistent with an economy that is expanding, but still muddling through. Here’s a bit more detail via the AAR:
“The Association of American Railroads (AAR) today reported mixed 2012 rail traffic compared with 2011. U.S. rail intermodal volume totaled 12.3 million containers and trailers in 2012, up 3.2 percent or 374,918 units, over 2011. Carloads totaled 14.7 million in 2012, down 3.1 percent or 476,322 carloads, from 2011. Intermodal volume in 2012 was the second highest on record, down 0.1 percent or 14,885 containers and trailers, from the record high totals of 2006.
In 2012, 12 of the 20 carload commodity categories tracked by AAR saw increases on U.S. railroads compared with 2011. The biggest gains were petroleum products, up 170,994 carloads or 46.3 percent; motor vehicles and parts, up 114,221 carloads or 16.5 percent; crushed stone, sand and gravel, up 71,012 carloads or 7.9 percent; and lumber and wood products, up 18,659 carloads or 13 percent.”
Chart via Orcam Investment Research:
Mr. Roche is the Founder and Chief Investment Officer of Discipline Funds.Discipline Funds is a low fee financial advisory firm with a focus on helping people be more disciplined with their finances.
He is also the author of Pragmatic Capitalism: What Every Investor Needs to Understand About Money and Finance, Understanding the Modern Monetary System and Understanding Modern Portfolio Construction.


Comments are closed.