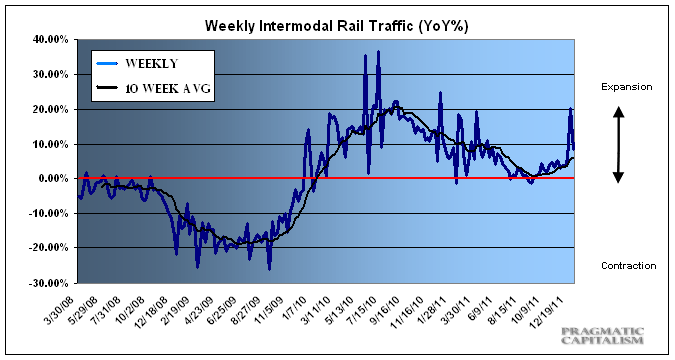
Rail traffic has remained a superb indicator over the course of the last 6 months and it’s been at least partially influential in my thinking that we were not headed for imminent recession (a call made 2 quarters ago). The latest data from the AAR continues to confirm this outlook. Year-end readings are always a bit bumpy due to the seasonal oddities that occur around the holidays and the new year, but the data is still telling a positive story. Via the AAR:
“The Association of American Railroads (AAR) today reported gains in 2011 rail traffic compared with last year, with U.S. railroads originating 15.2 million carloads, up 2.2 percent over 2010 and up 9.7 percent over 2009. Total U.S. rail intermodal volume in 2011 was 11.9 million trailers and containers, up 5.4 percent over 2010 and up 20.4 percent over 2009.
In 2011, 14 of the 20 carload commodity categories tracked by AAR saw increases on U.S. railroads compared with 2010 indicating a broad recovery across industry sectors. The largest gains were: metallic ores, up 20.5 percent or 67,631 carloads; primary metal products, up 12 percent or 56,988 carloads; and petroleum products, up 11.1 percent or 36,811 carloads. The commodity with the biggest carload decline in 2011 from 2010 was grain, down 27,946 carloads or 2.4 percent.
“A good beginning, some uncertainness in the middle, and then a good ending—that describes U.S. rail traffic in 2011,” remarked John Gray, AAR’s Senior Vice President for Policy and Economics. “We continue to see hopeful economic signs, as the industry prepares for 2012.”
AAR also announced gains in December 2011 rail traffic, with U.S. railroads originating 1,134,580 carloads, up 7.3 percent over December 2010, which is the largest year-over-year monthly increase since January 2011. U.S. rail intermodal originations totaled 873,390 containers and trailers, up 9.4 percent over December 2010. This is the second-highest monthly intermodal average for any December in history.
During December 2011, 16 of the 20 carload commodity categories tracked by the AAR saw increases compared with December 2010.
AAR reported gains in weekly rail traffic for the week ending December 31, 2011, with U.S. railroads originating 245,666 carloads, up 1.9 percent compared with the same week last year. Intermodal volume for the week totaled 181,217 trailers and containers, up 8.6 percent compared with the same week last year.
Ten of the 20 carload commodity groups posted increases compared with the same week in 2010, including: crushed stone, sand and gravel, up 35.2 percent; waste and nonferrous scrap, up 23.8 percent, and metals and products, up 15.7 percent. The groups showing a decrease in weekly traffic included: farm products, excluding grain, down 7.6 percent; primary forest products, down 6.5 percent, and food and kindred products, down 6.1 percent.
Weekly carload volume on Eastern railroads was down 5.3 percent compared with the same week last year. In the West, weekly carload volume was up 6.1 percent compared with the same week in 2010.
For the 52 weeks of 2011, U.S. railroads reported cumulative volume of 15,155,992 carloads, up 2.2 percent from last year, and 11,892,431 trailers and containers, up 5.4 percent from last year.”
Source: AAR
Mr. Roche is the Founder and Chief Investment Officer of Discipline Funds.Discipline Funds is a low fee financial advisory firm with a focus on helping people be more disciplined with their finances.
He is also the author of Pragmatic Capitalism: What Every Investor Needs to Understand About Money and Finance, Understanding the Modern Monetary System and Understanding Modern Portfolio Construction.


Comments are closed.