

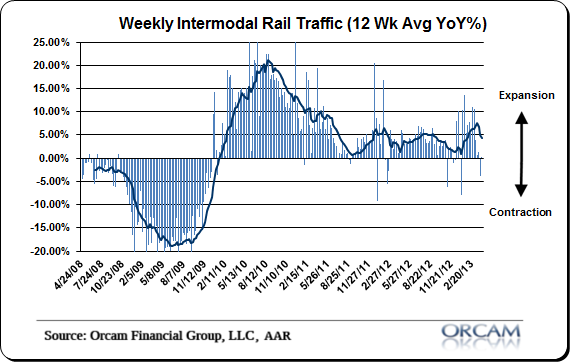
The latest rail data from the AAR showed another weak year over year reading at just 0.2%. This brings the 12 week moving average down to 5.25% from a recent high of 6.75% and is likely to slow substantially from here. Looking at the recent data and current trend it would not be surprising to see ~3% readings in this data by the time May rolls around.
For now, the data is still consistent with a growing economy, but it will be interesting to see how this data pans out as the summer rolls around. We’ve now had 4 consecutive weeks of negative average readings so hopefully this is not a developing trend.
The AAR has more details:
“The Association of American Railroads (AAR) reported an increase in traffic for the week ending April 6, 2013, with total U.S. weekly carloads of 280,748 carloads, up 3.7 percent compared with the same week last year. Intermodal volume for the week totaled 231,648 units, up 0.2 percent compared with the same week last year. Total U.S. traffic for the week was 512,396 carloads and intermodal units, up 2.1 percent compared with the same week last year.
Eight of the 10 carload commodity groups posted increases compared with the same week in 2012, including petroleum and petroleum products, up 52.9 percent, and nonmetallic minerals and products up 10.9 percent. Commodities showing a decrease were led by grain, down 14.2 percent.
For the first 14 weeks of 2013, U.S. railroads reported cumulative volume of 3,851,622 carloads, down 2.5 percent from the same point last year, and 3,316,564 intermodal units, up 5 percent from last year. Total U.S. traffic for the first 14 weeks of 2013 was 7,168,186 carloads and intermodal units, up 0.8 percent from last year.”
Mr. Roche is the Founder and Chief Investment Officer of Discipline Funds.Discipline Funds is a low fee financial advisory firm with a focus on helping people be more disciplined with their finances.
He is also the author of Pragmatic Capitalism: What Every Investor Needs to Understand About Money and Finance, Understanding the Modern Monetary System and Understanding Modern Portfolio Construction.
Comments are closed.