
I thought this was a nice bit of perspective from CitiGroup analysts regarding the historical drawdowns between stocks and bonds. Proper portfolio contruction is all about understanding how different asset classes operate relative to one another. And while the past doesn’t perfectly rhyme with the future, it does provide us with a better general understanding:
“Bitter experience means that the bond refugees are now very aware of the Warren Buffett classic: “The first rule of investing is don’t lose money; the second rule of investing is don’t forget rule number one”.
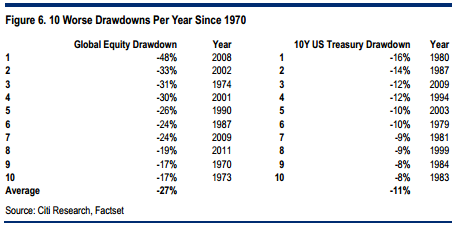
Perhaps this is what makes them such skittish participants in the equity market. Of course they can lose money in the bond market, but the equity market has always had the capacity to lose them so much more. Figure 6 shows the top ten global equity and US treasury draw-downs in each year since 1970.
There have been some ugly experiences for investors in the US treasury market over this period. For example, in 1980 10-year yields rose from 9% to 14%. Investors lost 16% of their capital. But this worst annual drawdown in treasuries wouldn’t even make the top ten for global equities. Equity investors lost 48% of their money in the 2008 drop and 33% in the 2002 correction. Even last year’s drawdown (-11% loss), which was seen as relatively mild, would rank as the fifth worst in 40 years of US treasury market performance.
Overall, the worst ten drawdowns in global equities average 27%. That’s way more than the 11% seen in US treasuries. Even in notorious years such as the bond selloff in 1994, losses for treasury investors were unexceptional (-12%) compared with those regularly experienced in global equity markets.”
Source: Citi
Mr. Roche is the Founder and Chief Investment Officer of Discipline Funds.Discipline Funds is a low fee financial advisory firm with a focus on helping people be more disciplined with their finances.
He is also the author of Pragmatic Capitalism: What Every Investor Needs to Understand About Money and Finance, Understanding the Modern Monetary System and Understanding Modern Portfolio Construction.
Comments are closed.