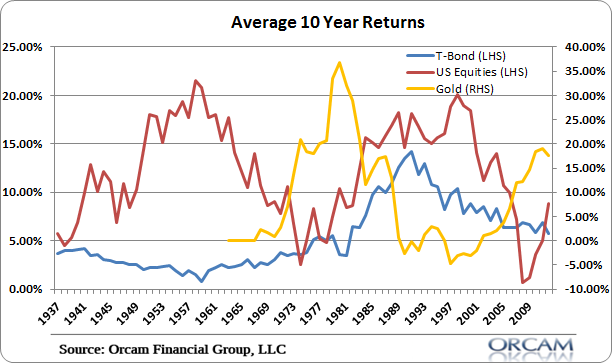
Here’s a good look at the 30,000 foot view of three major asset classes – gold, t-bonds and stocks. The following is the rolling 10 year average total returns since 1937. Gold was pegged prior to the 60’s so the data is a little light there. But I think the chart tells an interesting story for those of us who believe in mean reversion.
My big conclusions:
- Bonds are likely to perform much worse in the next 10 years than they have in the last 10 years.
- The gold rally probably isn’t over yet, but we’re closer to the beginning of a downside mean reversion than we are to a big upswing. That means gold is also likely to perform worse in the coming 10 years than it has in the last 10 years.
- Equities are coming off of a rather stagnant period and in the process of reverting upward.
Chart via Orcam Investment Research:
Mr. Roche is the Founder and Chief Investment Officer of Discipline Funds.Discipline Funds is a low fee financial advisory firm with a focus on helping people be more disciplined with their finances.
He is also the author of Pragmatic Capitalism: What Every Investor Needs to Understand About Money and Finance, Understanding the Modern Monetary System and Understanding Modern Portfolio Construction.


Comments are closed.