
Here’s an interesting chart and some stats frmo Merrill Lynch on long run stock market performance. Now, if we could only solve that whole, not being alive for 189 years, problem…..
- In the long-run stock prices rise.
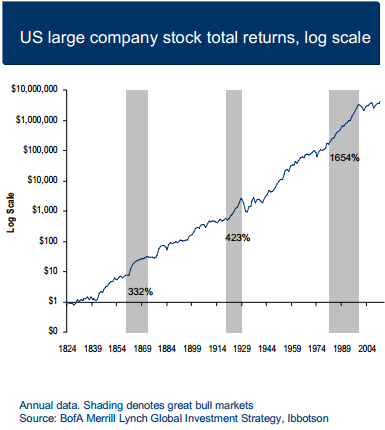
- $1 invested in US large company stocks in 1824 would be worth roughly $427 today in nominal terms.
- An even better stat for the bulls: $1 invested in US large company stocks in 1824 would be worth close to $4,225,000 with dividends reinvested, illustrating the power of compounding.
- The great equity bull markets - 1860-1872 = 332% total return; – 1920-1928 = 423% total return; and (the greatest of them all) 1982-1999 = 1654% total return
- From the March 2009 lows to their all-time high on August 2nd 2013, US large cap stocks have returned 177%.
Mr. Roche is the Founder and Chief Investment Officer of Discipline Funds.Discipline Funds is a low fee financial advisory firm with a focus on helping people be more disciplined with their finances.
He is also the author of Pragmatic Capitalism: What Every Investor Needs to Understand About Money and Finance, Understanding the Modern Monetary System and Understanding Modern Portfolio Construction.
Comments are closed.