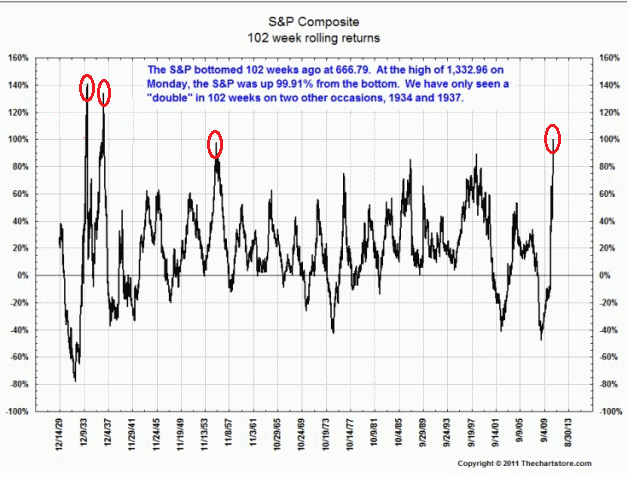
The current market rally of 100% in 102 weeks is highly unusual. How unusual? We’ve only experienced this kind of market performance 3 times in the last 80 years. This chart from The Chartstore shows just how unusual a rally of this magnitude is:

But who cares what the market has done. We want to know where the market is going. Although the sample size is poor it’s useful to gain some perspective from the past.
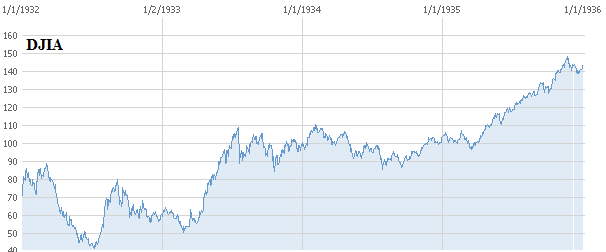
The 1932-34 rally took the market higher by 140% in one year. Although the market ultimately powered higher in 1935 the 34 market was largely sideways to down.

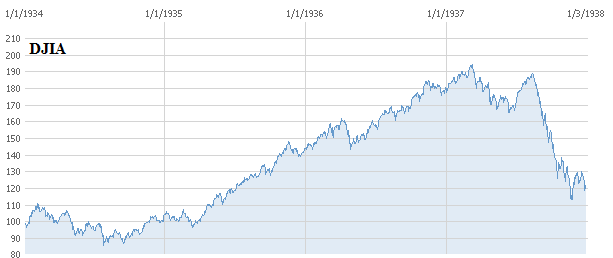
After the breather in 1934 the market continued its climb. Between 1934 and 1937 the market more than doubled again. Ultimately, the gains were given back as 1937 proved to be a disastrous year for the market. Equities traded sideways for the next 6 years.

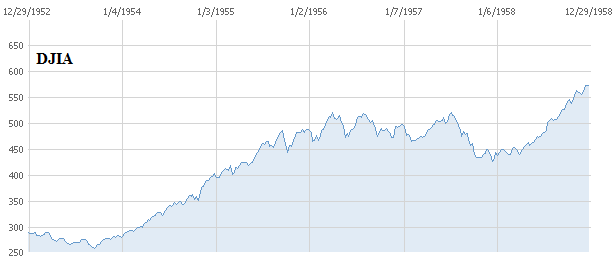
The 1952-1956 rally was similar to the 34 rally. The market powered higher in a near straight line over the course of a 95% rally. The market then hit a wall for two years before correcting 15% from its peak and then continuing its bull run. The 50’s ultimately proved to be a stellar year for equities.

The question the reader must then decipher is whether we are in the 50’s or the 30’s? While one was a disaster the other proved to be one of the great decades in investing history….
Mr. Roche is the Founder and Chief Investment Officer of Discipline Funds.Discipline Funds is a low fee financial advisory firm with a focus on helping people be more disciplined with their finances.
He is also the author of Pragmatic Capitalism: What Every Investor Needs to Understand About Money and Finance, Understanding the Modern Monetary System and Understanding Modern Portfolio Construction.

Comments are closed.