Yesterday’s GDP report was broadly better than expected. And one of the widely celebrated components of the report was the better than expected personal consumption expenditures. But how strong was this component in reality? When we take a step back and look at the bigger picture we can see just how weak the consumer remains.
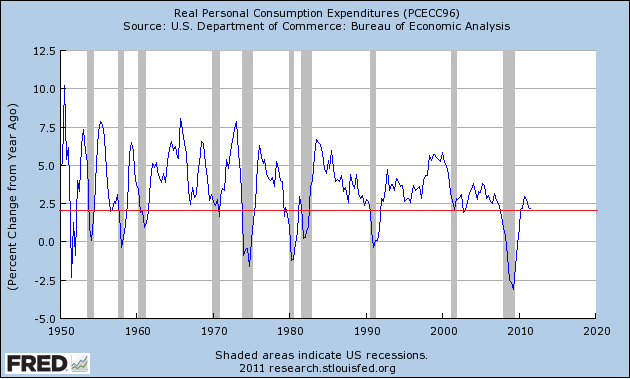
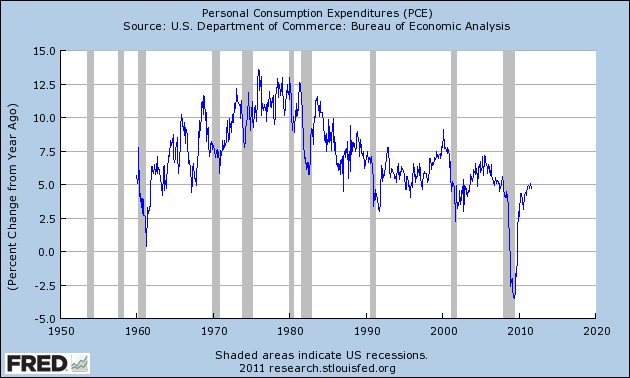
The Q3 real personal consumption expenditures came in at 2.2% year over year. Since 1950 RPCE has averaged 3.4%. Since 2005 it has averaged 1.5%. Since 2000 it has averaged 2.3%. Since 1990 it has averaged 2.8%. And since 2008 it has averaged 0.4%. If we put this all in picture format you can get a better gauge of the real situation (as seen below in figures 1 and 2). It’s not pretty.
The bottom line: we’re still in a secular weak period for the U.S. consumer as the de-leveraging continues. Large budget deficits are playing an important role here and as long as the USA doesn’t fall for the austerity trap during the next 24 months we should see a modestly growing economy. It’s a muddle through scenario, but thankfully, it’s not a collapsing growth scenario. As I’ve mentioned many times before, the risks are still exogenous as our weak patient heals very very slowly.

Figure 1 – Real Personal Consumption Expenditures

Figure 2 – Personal Consumption Expenditures
Mr. Roche is the Founder and Chief Investment Officer of Discipline Funds.Discipline Funds is a low fee financial advisory firm with a focus on helping people be more disciplined with their finances.
He is also the author of Pragmatic Capitalism: What Every Investor Needs to Understand About Money and Finance, Understanding the Modern Monetary System and Understanding Modern Portfolio Construction.

Comments are closed.