
Fantastic chart and data here from Citi Research showing the issuance of various securities over the last 10 years in the Eurozone, US and Japan. It’s interesting to note the surge in treasuries that has occurred since the collapse in the GSEs and the so-called AAA bubble in real estate. It’s also interesting to note the decline in net issuance. In other words, the supply of asset issuance continues to run at a level well below pre-crisis levels. That might explain at least some of the broad upward pressure on assets in general.
Here’s more excellent commentary from Citi:
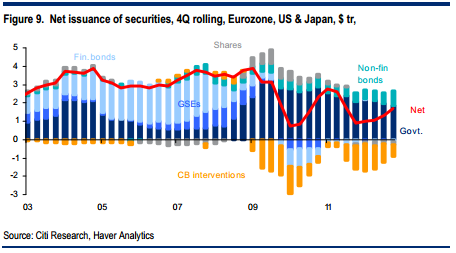
“The blue/grey bars quantify the net issuance of securities across broad asset classes on a rolling 4-quarter basis in the Eurozone, the US and in Japan. The orange bars capture the effects of central bank interventions. The red line is the net amount of issuance left after those interventions – in other words, it is a proxy for the change in the size of the universe of securities that investors can buy.
As you would expect, the chart shows a surge in net government debt issuance in 2009-10 as fiscal deficits ballooned. These have fallen back over the last couple of years but remain significantly higher than before the crisis.
The surge in corporate issuance of bonds since 2007 is perhaps less intuitive, considering that companies have generally run their balance sheets very conservatively, cutting capex and M&A. However, a big shift from loan to bond funding has more than compensated for that. Net equity issuance remains a relatively small component. There was a brief flurry of equity issuance in 2009-10, but as leverage has come down corporates have reverted to the more normal pattern of retiring shares on a net basis.
The biggest shift has been the drop in net issuance from financials and GSEs (like Fannie Mae and Freddie Mac). Having dominated securities markets before the crisis, their net issuance has dwindled to next to nothing in recent years.
Adding up the bars (still ignoring CB interventions in orange) shows that the growth in the investible universe has slowed from around $3.5-4tn annually before the crisis, to less than $2.5tn over the last couple of years. In other words, the rate of expansion of financial securities has slowed by more than $1tn. That’s a pretty penny, when you think about it.
When the effect of central bank interventions (quantitative easing and LTROs3) in orange is subtracted, the reduction in the supply of new assets available to financial investors becomes even more dramatic:
Apart from a brief period in H1 2011 (where markets incidentally did not perform particularly well), the investible universe of financial assets has grown by less than $2tr per year over the last three years – half the run-rate that we were used to. In fact, in some quarters net issuance of securities been virtually zero. We think this ‘supply effect’ on financial markets of central bank interventions is widely underestimated.”
.
Mr. Roche is the Founder and Chief Investment Officer of Discipline Funds.Discipline Funds is a low fee financial advisory firm with a focus on helping people be more disciplined with their finances.
He is also the author of Pragmatic Capitalism: What Every Investor Needs to Understand About Money and Finance, Understanding the Modern Monetary System and Understanding Modern Portfolio Construction.
Comments are closed.