
I’ve received a number of emails about this post at Zero Hedge which shows the deposit:loan ratio at JP Morgan. The authors cite this as a sign of “all that’s broken with the US financial system”. That description isn’t far off, but I do think it deserves some clarification.
First, forget JP Morgan. Here’s the whole banking system’s deposit to loan ratio:

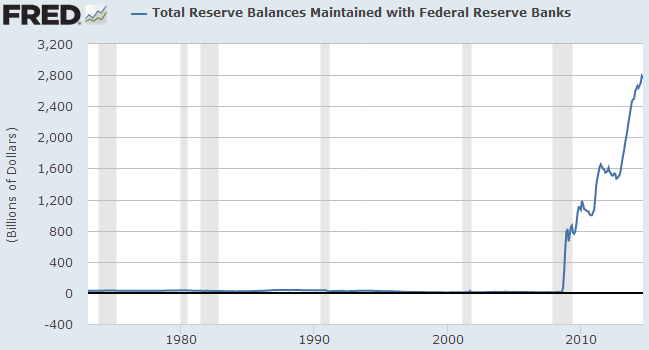
You’ll notice that that chart looks a lot like this chart of the reserve balances at Fed banks:
So, what’s going on at the bank level? Let’s break this down in simple steps:
1) We know that loans create deposits. Deposits are just the asset side of the borrower’s loan. Deposits are the “money” you actually borrow (although we shouldn’t think that the bank actually has the money or lends someone else’s money since the bank actually just creates the loan from thin air).
2) When the economy went into a state of deleveraging the normal process of deposit expansion via loans dried up. In other words, the money supply stopped expanding because the demand for loans dried up. So the Fed implemented QE to try to get more “money” into the system. This is typical Bernanke Monetarism – increase the money supply and inflation will follow. Of course, that’s not at all what happened as inflation has remained benign to say the least.

3) When the Fed expanded its balance sheet (also creating money from thin air just like banks do) they engaged in an asset swap with the private sector. They “printed” money into the private sector and “unprinted” T-Bonds and MBS from the private sector. All else being equal, this is a pure asset swap that changes the composition of the private sector’s balance sheet, but has no real reason to be inflationary since the program is much like swapping a savings account for a checking account.
4) The loan:deposit ratio is just a sign of the deleveraging we’ve been through and the weak demand for loans. So yes, it is a sign of “all that’s wrong with the US financial system” since it’s a sign of the deleveraging which has been the root cause of our weak economy.
5) BUT, we should also note that this ratio is improving dramatically as the economy has healed. In fact, lending is at its highest levels since the crisis. Deleveraging is a process and not an event as I’ve often noted. There are still big problems with the US economy, but we appear to be moving in the right direction. So don’t panic over this chart. Focusing on the aggregate size of the expansion of the deposit:loan ratio will lead you to miss the fact that things are getting better.
Some related work:
- Understanding the Modern Monetary System
- Your Textbooks Lied to you – the Money Multiplier is a Myth
- Understanding Quantitative Easing
Mr. Roche is the Founder and Chief Investment Officer of Discipline Funds.Discipline Funds is a low fee financial advisory firm with a focus on helping people be more disciplined with their finances.
He is also the author of Pragmatic Capitalism: What Every Investor Needs to Understand About Money and Finance, Understanding the Modern Monetary System and Understanding Modern Portfolio Construction.