With commodity costs going through the roof there has been quite a bit of disagreement about the validity of the US government’s inflation figures. Clearly, the government has an incentive to fudge the numbers, however, there are more than a few independent sources that provide reliable inflation data. Let’s take a look at a few:
The Billion Prices Project:
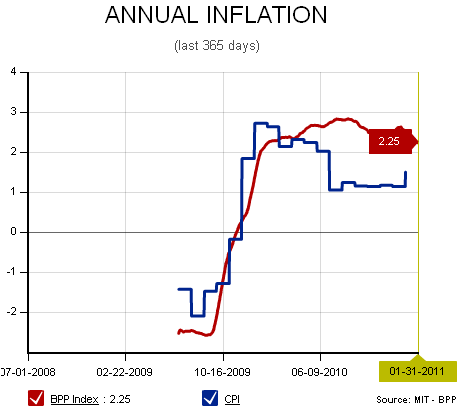
This index was created by MIT professors to provide a real-time inflation gauge. They monitor the daily price fluctuations of ~5 million items sold by ~300 online retailers in more than 70 countries. What is it currently saying? The annual inflation rate is running at 2.25% which is higher than the government’s latest CPI reading of 1.4%.

The ECRI’s Future Inflation Gauge:
The ECRI’s future inflation reading for December came in at 100.7. This was well below the highs seen in 2007, but also well off the lows of 2009. The smoothed annual rate came in at 3.1% although ECRI’s data does appear to be a bit more volatile than some other gauges (for instance, the trough deflation reading was -30% year over year). Nonetheless, they say that deflation and inflation fears are both overblown currently:
“With the USFIG hitting an eight-month high, there is certainly no deflation danger at this time, but inflation is likely to stay relatively restrained.”

TPC CPI:
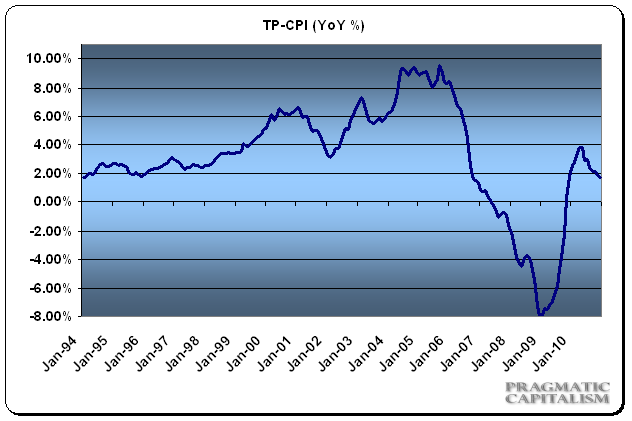
My metric alters the government CPI data to account for the cost of housing more accurately. The government’s OER (owners equivalent rent) is flawed in my opinion and doesn’t realistically measure the monthly costs of housing. Being the largest input in the average American’s monthly living costs, it’s important that this metric reflect reality. As you can see, this metric showed much higher levels of inflation in the mid-2000’s than the government was showing. It also showed deeper levels of deflation during the downturn. As of last month the data was showing a 1.75% year over year gain. This is higher than the government’s reading of 1.4%.

In sum, independent sources appear to verify this skepticism of the current CPI data, however, none are all that far off. While there is some chance that the government is understating the levels of inflation there is very little evidence showing that inflation is substantially higher than reported by the BLS. This makes sense. While we are seeing price increases in most commodities we are still seeing deflationary trends in labor rates, housing, auto, credit and consumer goods.
Mr. Roche is the Founder and Chief Investment Officer of Discipline Funds.Discipline Funds is a low fee financial advisory firm with a focus on helping people be more disciplined with their finances.
He is also the author of Pragmatic Capitalism: What Every Investor Needs to Understand About Money and Finance, Understanding the Modern Monetary System and Understanding Modern Portfolio Construction.

Comments are closed.