
With just a few weeks left in the year it looks like we’re likely to end up with a relatively rare 25%+ year on the S&P 500. MKM Partners listed some interesting data about the unusual 25%+ year in the market and what we can expect following such a big move. They said:
“What is unusual is that this year we’re following 2012 which was up 13%,” Krinsky says, noting that of the sixteen times the market has delivered that degree of upside since 1928, “only four them followed a year that was up 13% or more.”
…
Krinsky also points out that, more often than not, these type of outsized years tend to spill over into the following year, writing that “Overall, following an up 25% year, the following year is higher 66% of the time, for an average move of +5.47%.”
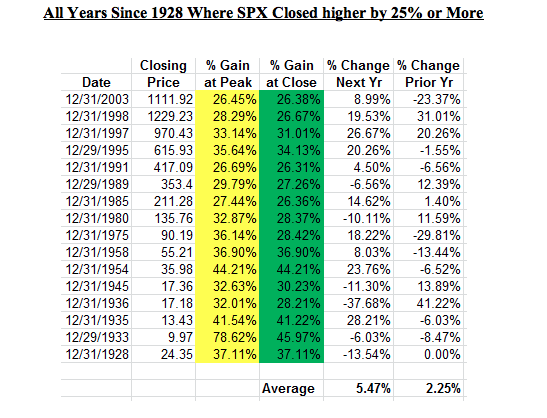
There’s a few interesting things here. That average change in the S&P is actually about HALF of the average annual return of 11.5% since 1928. Further, of the 4 years where there was a 12% and subsequent 25%+ year (as we currently have), all were relatively extreme. In the 1945 market the 25%+ year was followed by a -11.3% decline while the 1989 market was followed by a -6.56% year. The other two years with back to back 12%+ and 25%+ years were both followed by big booms during the Nasdaq bubble. So one might conclude that the market is likely to move substantially in one direction or the other in the coming year.
But does this data really tell us anything all that useful. Call me skeptical. I don’t find such small datasets particularly useful. John Templeton once said that the four most dangerous words in investing were “it’s different this time”. But I actually think it’s always different this time. We have to study each market environment as if it’s its own unique environment. And that means the past can give us some idea of what’s to come, but I would be hesitant about weighting one’s portfolio based on such data.
Mr. Roche is the Founder and Chief Investment Officer of Discipline Funds.Discipline Funds is a low fee financial advisory firm with a focus on helping people be more disciplined with their finances.
He is also the author of Pragmatic Capitalism: What Every Investor Needs to Understand About Money and Finance, Understanding the Modern Monetary System and Understanding Modern Portfolio Construction.
Comments are closed.