

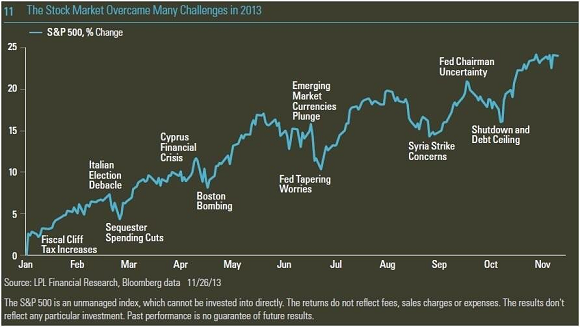
Nice chart here from LPL Financial. It shows the 2013 “wall of worry”. I attached a bit of the commentary as well:
“When we take a look at weather forecasts, such as those in farmers’ almanacs, we do not often consider any bias by the source of those forecasts. But maybe we should. It turns out that when it comes to weather forecasting, it is common to find low-probability outcomes consistently overestimated by forecasters. For example, according to a study at Texas A&M “when TWC (The Weather Channel) forecasted a 0.2 (20%) chance of precipitation for the same day, precipitation occurred only 5.5% of the time.”
The well-known bias of weather forecasters to exaggerate fears of negative, low-probability outcomes, such as the likelihood and amount of snowfall, also often appears in the forecasts of non-weather-related issues. We saw this bias in the media over the antics in Washington, D.C., fixating on the threat of a default on U.S. Treasury debt during the debt ceiling discussions, or a return to recession due to the impact of the sequester spending cuts. This bias could also be seen in events beyond the United States’ borders in the exaggerated attention devoted to the threat of another financial crisis stemming from the Cyprus bank bailout, the risk of the outcome of the Italian elections plunging the Eurozone debt markets into chaos, and the risks of a strike on Syria turning into a major geopolitical military engagement.
Of course, the probabilities of those outcomes were very low, and the markets did not dwell on those potential outcomes. Market participants tuned them out, and the S&P 500 moved steadily higher throughout the year without experiencing more than a 6% pullback at any point [Figure 11]. We believe it will be safe in 2014 to again tune out much of the antics in Washington, D.C. as the mid-term elections turn up the volume but not the impact.”
Source: LPL Financial
Mr. Roche is the Founder and Chief Investment Officer of Discipline Funds.Discipline Funds is a low fee financial advisory firm with a focus on helping people be more disciplined with their finances.
He is also the author of Pragmatic Capitalism: What Every Investor Needs to Understand About Money and Finance, Understanding the Modern Monetary System and Understanding Modern Portfolio Construction.
Comments are closed.