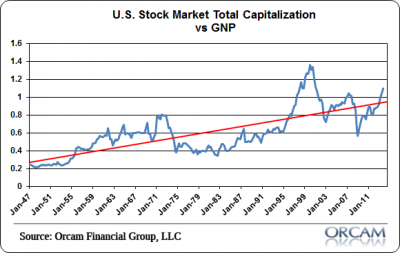
Here’s some perspective on the potential value of the US equity market using total stock market capitalization relative to GNP. This is an indicator that Warren Buffett has previously referred to as his favorite valuation metric.
Of course, the stock market is not the economy and in fact, the total market cap of the US equity market has tended to grow quite a bit faster than Gross National Product. So there’s some natural upside bias in an indicator like this. But if we use a linear trendline we can better gauge where we are.
Based on this perspective the US stock market is starting to looking a little expensive. At a level of 1.1 (using estimated Q4 GNP) the US stock market is now about 15% above trend. That would put our “fair value” for the S&P at about 1520 at present (all else equal).
Obviously, this is a rather imprecise way of viewing things, but it does provide a bit of perspective on where we might be in the market cycle. Multiple expansion and paying more for less earnings appears to be the most obvious driver of the market at present.
Mr. Roche is the Founder and Chief Investment Officer of Discipline Funds.Discipline Funds is a low fee financial advisory firm with a focus on helping people be more disciplined with their finances.
He is also the author of Pragmatic Capitalism: What Every Investor Needs to Understand About Money and Finance, Understanding the Modern Monetary System and Understanding Modern Portfolio Construction.


Comments are closed.