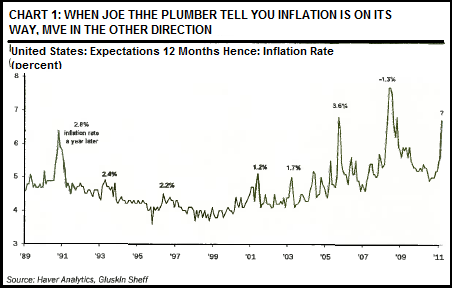
Is there a bubble in inflation expectations? In his latest research piece David Rosenberg posts an interesting tidbit – should we view John Q Public’s inflation expectations as a contrarian sign? Mr. Rosenberg says:
“The chart below depicts…12 month inflation expectation by John and Jane Q Public. Their forecasting record is a riot – it’s even worse than most economists. But each time in the past that the Conference Board’s inflation expectation index either approached or crossed above the 6% mark, inflation actually fell in the ensuing year each time, and by an average of more than three-percentage points. So when did this metric rise above 6% this time around? Try March. And what was headline inflation at the time? Call it roughly 2.5%. Do the math – think we may be talking about deflati0n again this time in 2012?”

Very interesting. If there was ever something cyclical it is sentiment. Parabolic sentiment charts are never a good sign. If I could short this index I would place a virtual guarantee on my ability to make money in the coming 6 months. Unfortunately, making money isn’t that simple. But the chart certainly makes one wonder if there isn’t a bubble in inflation expectations due in large part to QE2 and seasonal trends in commodities?
Source: Gluskin Sheff
Mr. Roche is the Founder and Chief Investment Officer of Discipline Funds.Discipline Funds is a low fee financial advisory firm with a focus on helping people be more disciplined with their finances.
He is also the author of Pragmatic Capitalism: What Every Investor Needs to Understand About Money and Finance, Understanding the Modern Monetary System and Understanding Modern Portfolio Construction.

Comments are closed.