The team at Business Insider reached out to a lot of great analysts (and then clearly ran out of good sources and reached out to me) for their take on [ … ]
Category: Chart Of The Day
(Just Charts)
The Economics of Japan’s Lost Decade
Here’s an excellent piece of research from Tanweer Akram of ING discussing the economics of Japan over the course of their continuing balance sheet recession.
Inflation Update – Are Prices Turning up?
Today’s BLS reading on the CPI showed another benign price increase. Econoday has a good breakdown: “Excluding food and energy, the CPI rose 0.1 percent, following a boost of 0.2 [ … ]
Germany’s ZEW Sentiment Indicator – Things Are Looking Up
Today’s big market rally is, at least in part, due to the very positive ZEW reading in Germany. The leading indicator posted a positive result for the first time since [ … ]
The “Single Best Chart” on Employment?
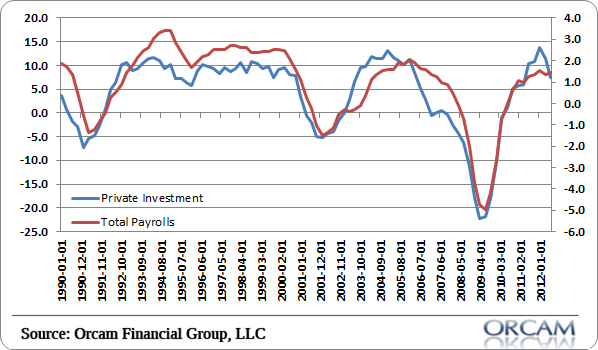
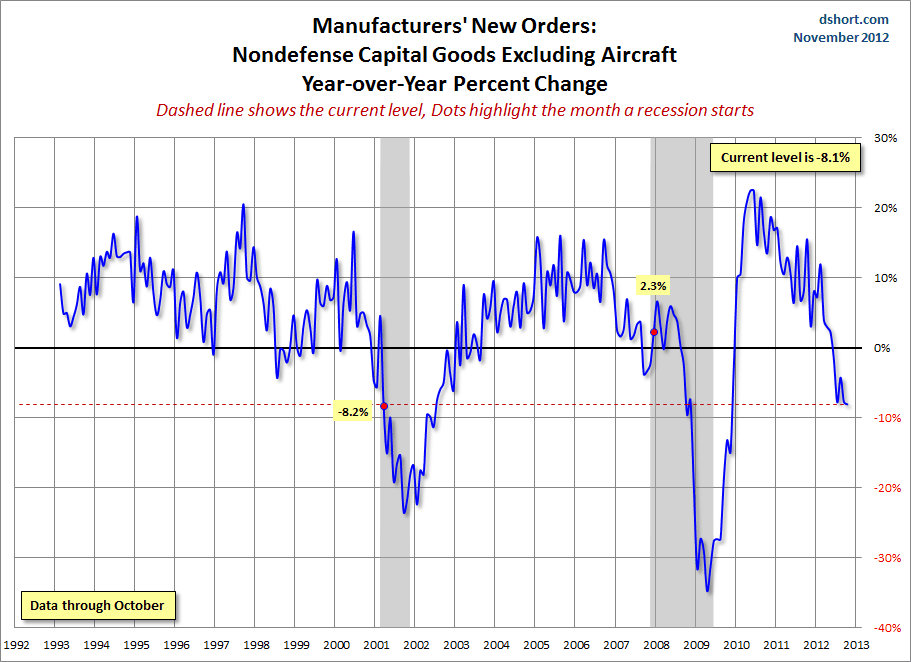
I saw this video on Bloomberg last week showing the rate of change in business investment in machines compared to employment. I’ve seen similar charts of nondefense capital goods orders all over [ … ]
3 Bearish Signs in a Sea of Negativity
Last week I published the 3 bullish signs in a sea of negativity (click here). So I figured I’d even the score and mark down some of the more bearish [ … ]
Corelogic: Home Prices are up 6.3% YoY in October
More good news on the housing front via CoreLogic: CoreLogic, a leading provider of information, analytics and business services, today released its October CoreLogic HPIreport. Home prices nationwide, including distressed [ … ]
GDP Weighted PMI Consistent With Expanding Global Economy
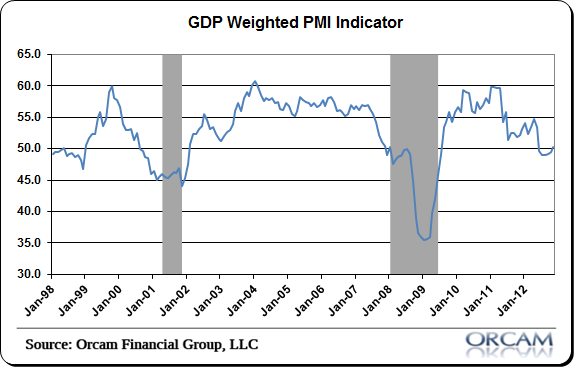
This morning’s global PMI readings were a mixed bag on the whole, but showed mild improvement. Notable improvements came from the EMU, USA and China. The EMU is clearly still [ … ]
Parsing the Effects of the Fiscal Cliff
Just in case you haven’t gotten enough of the fiscal cliff…here’s a nice breakdown by policy and its impact on 2013 GDP by quarter via Macroeconomic Advisors: We’re often asked [ … ]


