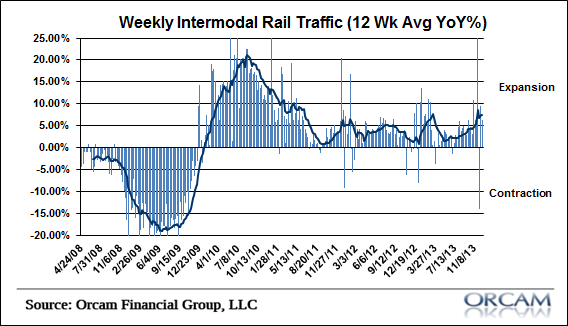
The latest rail traffic trends showed continued strength as intermodal traffic recorded its seconded highest ever weekly reading. Intermodal traffic was up 6.4% year over year and the 12 week [ … ]
Category: Chart Of The Day
(Just Charts)
EuroZone ZEW Points to Stronger Equity Markets
Interesting data point here from Guggenheim’s weekly note which might be of particular interest for European readers: “The ZEW survey of investor expectations for economic growth in the euro zone [ … ]
The Most Important Charts of 2013…
This is always a good post from Business Insider. My contribution was kind of obvious, given that I’ve focused so much on household debt trends in the last 5 years: [ … ]
Updating Warren Buffett’s Favorite Valuation Metric
Here’s some perspective on the potential value of the US equity market using total stock market capitalization relative to GNP. This is an indicator that Warren Buffett has previously referred [ … ]
The Stupidest (and most prominent) QE Chart in the World
Sorry for the belligerent post title, but I really hate the chart below. You know it. You’ve seen it all over the place for 5 years straight. Heck, I’ve probably [ … ]
Rail Traffic Continues to Post Strong Gains
Rail traffic trends continue to point to a positive overall economic outlook. Intermodal traffic has been choppy in recent weeks due to seasonal discrepancies, but the 12 week moving average [ … ]
3 Very Bearish Charts
I know it’s not fashionable to be bearish about anything these days, but I guess I just can’t kill the old risk manager in me. Given this predisposition, I wanted [ … ]
More on “Japan on Fast Forward”
One thing I highlighted in my talk yesterday at the University of South Carolina was this idea that the US economy more closely resembles Japan in the 90’s more than [ … ]
The Balance Sheet Recession is Over
I am glad (and sad) to say that the Balance Sheet Recession in the USA appears to be over. Yesterday’s Z.1 report from the Fed confirmed that households have indeed [ … ]


