Last week’s employment report and 7% unemployment rate in the USA had many people (including markets) cheering the news. But here’s something you might not know – while there’s been [ … ]
Category: Chart Of The Day
(Just Charts)
Central Banks are Still Constraining Net Securities Supply
This is one of the more important charts out there today. One of the impacts of QE is that it reduces the amount of outstanding portfolio options for investors. When [ … ]
The 2013 Wall of Worry
Nice chart here from LPL Financial. It shows the 2013 “wall of worry”. I attached a bit of the commentary as well: “When we take a look at weather forecasts, [ … ]
Shiller: “We can’t trust momentum in the housing market”
Robert told CNBC this morning that the 12% year over year rate of change in house prices can’t be trusted. No kidding. To put this in perspective I charted out [ … ]
The Quantitative Easing Behavioral Cycle
At an operational level I actually find Quantitative Easing to be incredibly boring and not nearly as impactful or sophisticated as most people tend to think. After all, from the [ … ]
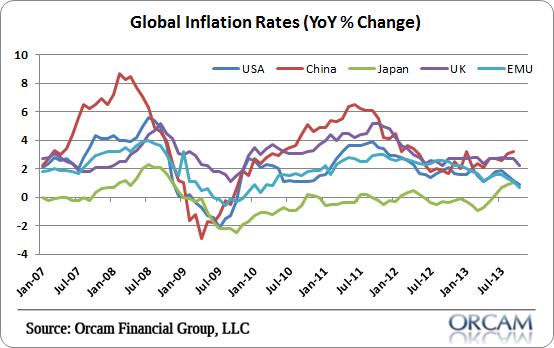
A World of Low Inflation
This morning’s CPI showed another very low reading at 0.9% on the headline and 1.7% at the core. It’s interesting to note that food and energy are now dragging down [ … ]
Chart of the Day – Worth a Thousand Words?
DJIA gains off of 5 year lows…scary or not?
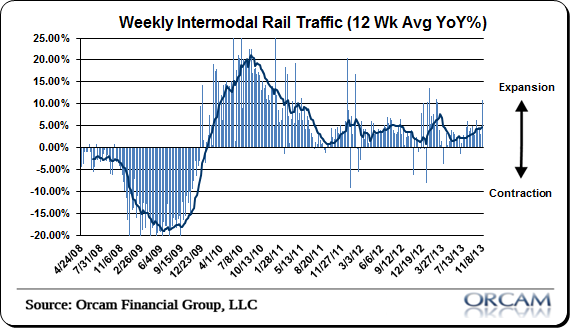
Rail Traffic Logs Highest Reading in 7 Months
Rail traffic continues to tell an optimistic economic story as the AAR reported a 10.8% surge in weekly intermodal traffic. This reading brings the 12 week average to 4.9% which [ … ]
The Not So Great Rotation
Remember all that chatter earlier this year about the “great rotation” and how bonds were going to get crushed because everyone was “rotating” into stocks? That seems to have died [ … ]


