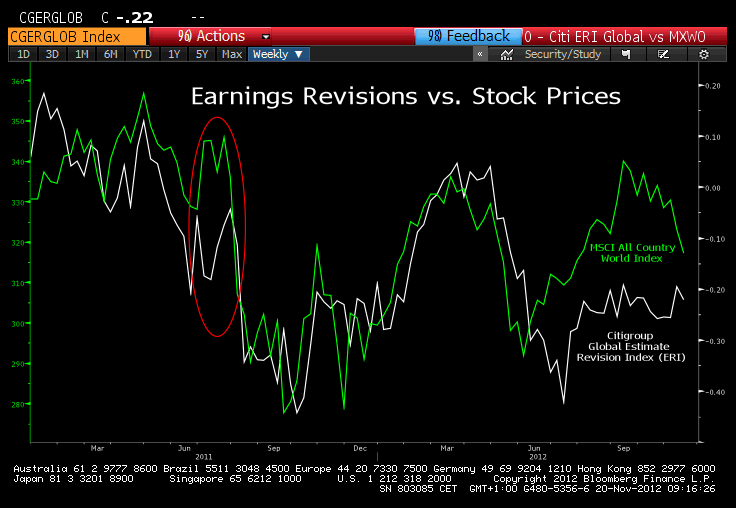
With all the macro currents it’s difficult to remember that profits are ultimately the primary driver of stock prices. This chart via Bloomberg and our friend Martin at Macronomics shows the very close correlation between the changes in earnings expectations and stock prices:
“Lower earnings estimates are dragging down stocks from this year’s highs and their full effect has yet to be felt, according to Hasan S. Tevfik, a global equity strategist at Citigroup Inc. The CHART OF THE DAY compares the performance of an earnings-revision index, or ERI, compiled weekly by Citigroup with MSCI Inc.’s All-Country World Index since the beginning of last year. Tevfik had a similar chart in a report yesterday. Since the first week of May, the revision index has been less than zero, which means there were more estimate cuts than increases among analysts.
The MSCI gauge of stocks in developed and emerging markets rose to its peak for the year in September and then lost as much as 6.7 percent. “ERI remains an anchor for global equity markets,” Tevfik wrote. A similar disparity between estimate changes and share prices in 2011 was resolved when stocks declined in July and August of that year, the London-based strategist added. The chart highlights the earlier retreat. Earnings projections for next year are poised to decline further, he wrote, citing the gap between analysts’ estimates for companies and strategists’ projections for stock indexes.
Citigroup strategists are collectively calling for profit growth of 7 percent, trailing a 12 percent increase implied by company-specific estimates, Tevfik wrote. The lower figure maybe too high, he added, as economic growth slows worldwide.”
Source Bloomberg
Mr. Roche is the Founder and Chief Investment Officer of Discipline Funds.Discipline Funds is a low fee financial advisory firm with a focus on helping people be more disciplined with their finances.
He is also the author of Pragmatic Capitalism: What Every Investor Needs to Understand About Money and Finance, Understanding the Modern Monetary System and Understanding Modern Portfolio Construction.


Comments are closed.