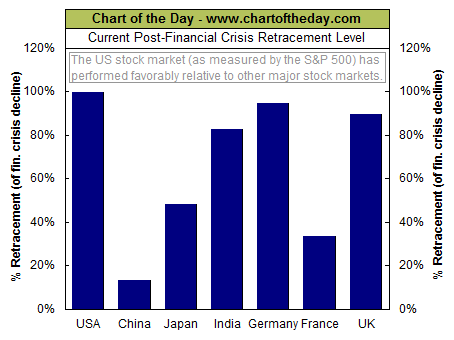
Just a bit of big picture perspective here courtesy of Chart of the Day. It shows various market retracements in the post-crisis period:
“For some perspective on the post-financial crisis rally, today’s chart illustrates how much of the downturn that occurred as a result of the financial crisis has been retraced by several major international stock market indices.
For example, the S&P 500 peaked at 1,565.15 back in October 9, 2007 and troughed at 676.53 back on March 9, 2009. The most recent close for the S&P 500 is 1,563.77 — it has retraced 99.8% of its financial crisis bear market decline. As today’s chart illustrates, China (Shanghai Composite), Japan (Nikkei 225), India (S&P BSE Sensex), Germany (DAX), France (CAC 40) and the UK (FTSE 100) are all above their financial crisis lows (i.e. above 0% on today’s chart) while none of the aforementioned countries are currently trading above their respective pre-financial crisis peak (i.e. none are above 100% on today’s chart). It is interesting to note that the US (epicenter of the financial crisis) has outperformed the other major stock market indices while China has lagged.”
Mr. Roche is the Founder and Chief Investment Officer of Discipline Funds.Discipline Funds is a low fee financial advisory firm with a focus on helping people be more disciplined with their finances.
He is also the author of Pragmatic Capitalism: What Every Investor Needs to Understand About Money and Finance, Understanding the Modern Monetary System and Understanding Modern Portfolio Construction.


Comments are closed.