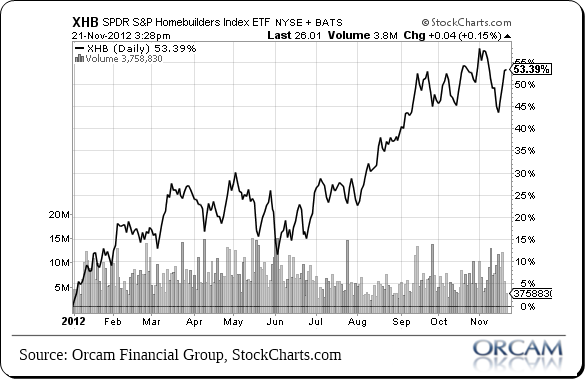
Here’s a great statistic that I think has a good lesson behind it. If you look at actual home prices this year they’re not up all that much. The Case Shiller index is up about 4.5% year-to-date. But the S&P Homebuilders Index ETF is up almost 55% year-to-date.
Now, this might sound baffling to some, but it makes complete sense. Corporations ultimately represent the leveraging of some resources in our world. I often discuss how silly it is to think you’re “investing” in commodities because the long-term real returns are atrocious. If you want to leverage a commodity price increase you don’t want to buy the asset that is increasing in price. What you really want to “invest” in is the ingenuity in the way that resource will be leveraged to generate output and ultimately profits.
Now, homebuilders aren’t a perfect corollary here because they’re not commodity companies (well, in a sense they are), but the idea is the same. Homebuilders don’t need a huge increase in price for their profits to become multiplied due to the boom in the underlying asset they primarily deal in. In essence, homebuilders are leveraging this underlying asset in various ways to generate a profit. Obviously, some firms do this more efficiently than others. But that’s the basic power in understanding why corporations sit atop the hierarchy of assets. They are ultimately where the ingenuity and leveraging of resources translates into real profits and real wealth increases.
(Chart via Orcam Investment Research)
Mr. Roche is the Founder and Chief Investment Officer of Discipline Funds.Discipline Funds is a low fee financial advisory firm with a focus on helping people be more disciplined with their finances.
He is also the author of Pragmatic Capitalism: What Every Investor Needs to Understand About Money and Finance, Understanding the Modern Monetary System and Understanding Modern Portfolio Construction.


Comments are closed.