Today is looking like the mirror image of yesterday in terms of economic data. While there was nothing to get upset about yesterday, today, there’s nothing to be happy about. The data is negative across the board. Let’s take a look at this morning’s news:
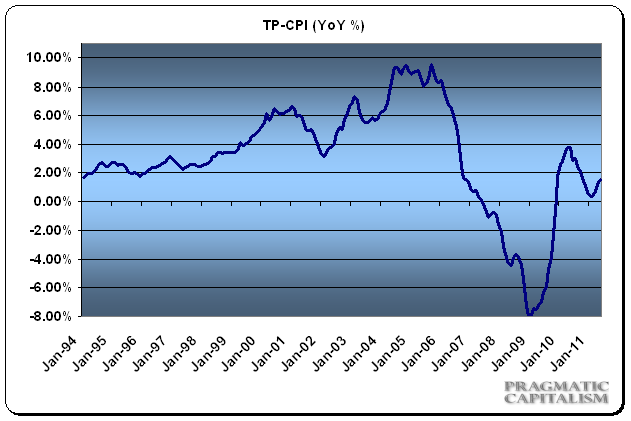
- Inflation continued to rise although the pace of change is slowing. Year over year inflation is now 3.4% or right in-line with its historical average. Core inflation remains substantially lower at 1.5%. The most notable increase is still transportation and gasoline related components which were up 13.1% on a year over year basis, but down on a monthly basis and helping contribute to slowing pace of change. Motor fuel accounted for a full 37% year over year increase. Housing was up 1.2% while food rose 3.6%. My inflation gauge, which accounts for the cost of housing more accurately, was up to 1.5% year over year. This is exactly in-line with core inflation. I believe the CPI’s reflection of rising housing does not properly measure the actual environment in which we are in. As you’ll notice from the accompanying chart, this metric showed much higher inflation during the housing boom.

- The Empire State Manufacturing Survey showed a marked decline in business conditions. The NY Fed reports:
“The Empire State Manufacturing Survey indicates that conditions for New York manufacturers deteriorated in June. The general business conditions index slipped below zero for the first time since November of 2010, falling twenty points to -7.8. The new orders and shipments indexes also posted steep declines and fell below zero. The index for number of employees dropped fi fteen points to 10.2. The indexes for both prices paid and prices received were positive but lower than last month, suggesting that increases in input prices and selling prices had slowed. Although future indexes were generally above zero, they were well below last month’s levels, indicating that the level of optimism about the six-month outlook had deteriorated significantly.”

- Industrial production began to show signs of slowing as well with the Federal Reserve reporting a slow-down in the pace of change in manufacturing and total capacity utilization. They report:
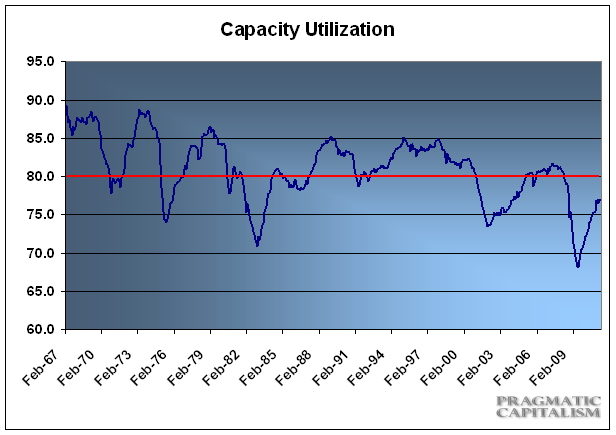
“Industrial production edged up 0.1 percent in May, the second consecutive month with little or no gain. Revisions to total industrial production in months before May were small. In May, manufacturing production rose 0.4 percent after having fallen 0.5 percent in April. The output of motor vehicles and parts has been held down in the past two months because of supply chain disruptions following the earthquake in Japan. Excluding motor vehicles and parts, manufacturing output advanced 0.6 percent in May and edged down 0.1 percent in April; the decrease in April in part reflected production lost because of tornadoes in the South at the end of the month. Outside of manufacturing, the output of mines increased 0.5 percent in May, while the output of utilities fell 2.8 percent. At 93.0 percent of its 2007 average, total industrial production in May was 3.4 percent above its year-earlier level. Capacity utilization for total industry was flat at 76.7 percent, a rate 3.7 percentage points below its average from 1972 to 2010.”
Not a lot of good news here. But that’s to be expected when policymakers consistently fail to properly diagnose our problems while implementing policies that increase inflation and help contribute to an already slow economic environment.
Mr. Roche is the Founder and Chief Investment Officer of Discipline Funds.Discipline Funds is a low fee financial advisory firm with a focus on helping people be more disciplined with their finances.
He is also the author of Pragmatic Capitalism: What Every Investor Needs to Understand About Money and Finance, Understanding the Modern Monetary System and Understanding Modern Portfolio Construction.


Comments are closed.