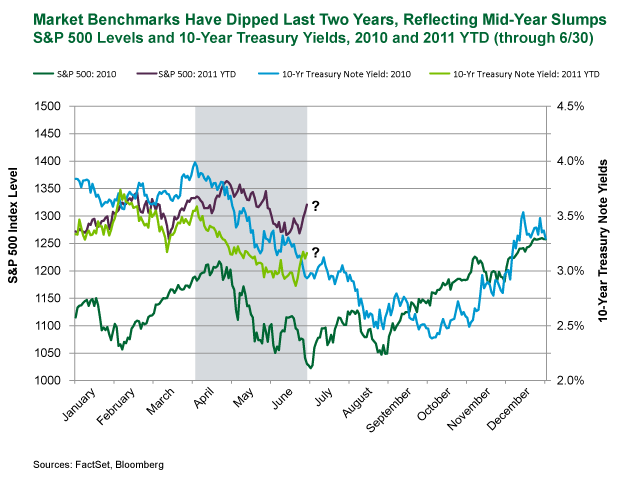
A little datamining never hurt anyone. And here’s a fine piece of it. The market has troughed during the summer in each of the last two years. And to be fair, summer is a notoriously poor market period on a historical basis with the end of the year being one of the better seasonal periods. But American Century Investments recently noted that the performance this year is eerily reminiscent of both 2009 and 2010. Will this year be the same? Should we prepare for both higher yields AND higher equity prices into year-end? Via ACI:
“The mid-year U.S. economic slumps of the past two years can be shown graphically, reflected in the declines of benchmark stock indices and Treasury yields over the period. The graph below shows the behavior of the S&P 500 index and the 10-year U.S. Treasury yield in 2010 and 2011 year to date through June 30. Note the similar dips in all four lines within the shaded second-quarter period for both years “:
Source: American Century Investments
Mr. Roche is the Founder and Chief Investment Officer of Discipline Funds.Discipline Funds is a low fee financial advisory firm with a focus on helping people be more disciplined with their finances.
He is also the author of Pragmatic Capitalism: What Every Investor Needs to Understand About Money and Finance, Understanding the Modern Monetary System and Understanding Modern Portfolio Construction.


Comments are closed.