

There’s been some chatter in recent days about math in economics and whether it’s all that valuable despite its sometimes, um, unrealistic assumptions. Yesterday, I went into some detail about why I don’t think the math behind the IS/LM model equates to the conclusions that some economists think it does. The primary flaw in the IS/LM model is that it is quantity centric which doesn’t really provide us with an accurate real-world view of our economy and the drivers of growth at all times. I think it was particularly inapplicable in understanding QE and the de-leveraging of recent years.
Anyhow, what’s interesting about the models Dr. Krugman and I used is, despite being rather different, we came up with the same basic conclusions to resolve the crisis – government deficits and fiscal policy were the key. I think we can look back and say the models generated most of the same (correct) predictions regarding inflation, growth, interest rates, etc. But the same results don’t mean the models and views were exactly the same.
Now, I am claiming that the Krugman IS/LM model was right, but for the wrong reasons. That’s because this quantity centric view of the world didn’t show us a real monetary transmission mechanism to get the economy going again. In other words, if QE was just swapping reserves for t-bonds (resulting in no net change to their balance sheets) and banks don’t lend reserves then what was the transmission mechanism for QE to get things going? Ie, QE wasn’t really “money printing” so it wasn’t going to kick-start anything. And I am claiming that the key to understanding the crisis and low inflation wasn’t the liquidity trap, but the consumer debt issue and lack of demand for debt. But can these views be rectified and perhaps even brought together to some degree? I think so.
In 2009 my friend Rob Parenteau wrote a superb piece on this exact topic so I am going to steal quite a bit from him going forward. He cited a piece by Paul Krugman from July 2009 that declared how “deficits saved the world”. It was actually quite prescient given that the world was still engulfed in turmoil at the time. Anyhow, Rob pointed to an important chart that he called the “Krugman Cross”:

That chart is just a really confusing looking version of the chart below which shows how the Federal Government’s deficit is equal to the non-government’s surplus. In layperson’s terms, the government’s debt is the non-government’s asset. So, all those t-bonds grandma owns (part of her saving) are there because the government sold it to her.
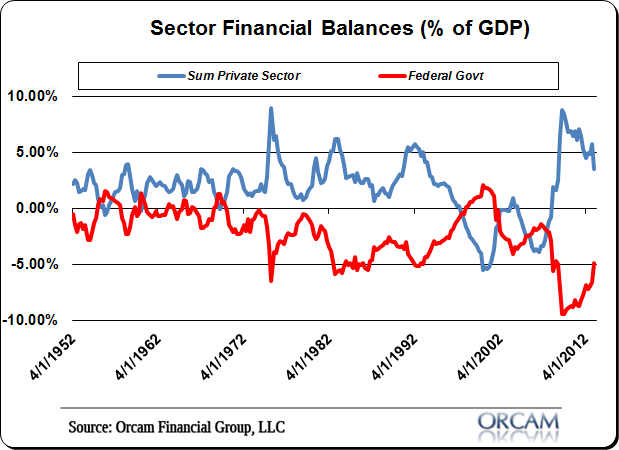
Now, I hate using a two sector analysis like this because it leaves some of the most important pieces of the puzzle out of the picture, but this was super important to understand during the crisis because the US economy kind of became a two sector environment for a brief while. Why? Because the private sector slumped in an unprecedented manner as a result of the consumer credit bubble. And when consumers started repairing balance sheets they stopped borrowing and spending. And when they stopped borrowing and spending corporate revenues declined, defaults surged, the banking sector collapsed, etc. Now, as the private balance sheet was shrinking due to de-leveraging and corporations were choked off by weak aggregate demand, this really became a one man party. And if the government hadn’t picked up the tab then we were all left out to dry. We would look a lot more like Greece or the USA in the 30’s than we do today.
So, what happened during the last few years was that the government went on a spending binge. They spent more than they taxed and as a result they not only increased the flow of income in the private sector, but they added assets to the private sector because t-bonds are a private sector asset with no corresponding private sector liability (the liability is the government’s). Now, it’s tricky to call t-bonds “money printing” because t-bonds aren’t money in the sense that we all think, but this was definitely “asset printing” and that directly helped improve the overall private balance sheet.
How does this all tie back into the IS/LM? Well, the mistake that most people made with QE was that they assumed QE was “money printing” when it was really just “asset swapping”. The Fed was removing a t-bond from the private sector and replacing it with the reserves. And since this wasn’t going to boost lending and it didn’t improve private balance sheets (aside from the wealth effect) it proved to be a very indirect and ineffective way to boost the economy during the crisis. What was hugely impactful, on the other hand, was over $1 trillion of net risk free financial assets being added to the private sector every year due to the deficit as households repaired their balance sheets.
Said differently, understanding the Krugman Cross was the key to understanding why the economy didn’t go into a depression. And you didn’t need to use the IS/LM approach to get any of this.
Mr. Roche is the Founder and Chief Investment Officer of Discipline Funds.Discipline Funds is a low fee financial advisory firm with a focus on helping people be more disciplined with their finances.
He is also the author of Pragmatic Capitalism: What Every Investor Needs to Understand About Money and Finance, Understanding the Modern Monetary System and Understanding Modern Portfolio Construction.
Comments are closed.