I am kind of out of the loop here due to travel so my apologies on such a brief post.
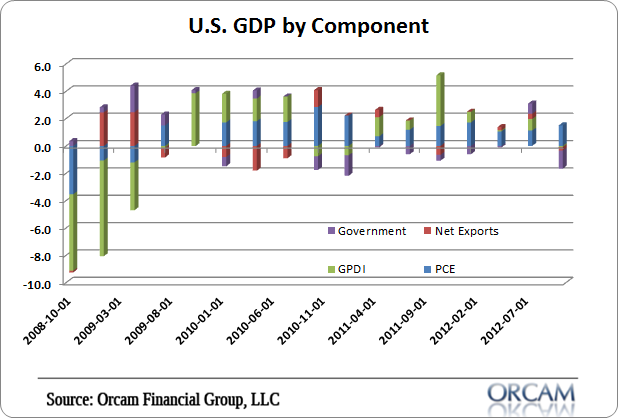
As you likely know by now, Q4 GDP fell by -0.1%. A decline in the rate was expected, but worse than analyst expectations of 1% growth. The decline was primarily driven by declines in government spending and private investment. We can get a bit more granular by focusing on the specific components by contribution. Remember, GDP = C + I + G + (X-M) where C is personal consumption, I is private Investment, G is government expenditure and (X-M) is net exports. The math here is pretty simple. The quarterly the breakdown was as follows:
GDP = C + I + G + (X-M)
or
-0.1% = 1.52% + -0.08% + -1.33% + -0.25%
See figure 1 below for the visual breakdown. Obviously, the big drag is due to the fastest pace of decline in defense spending (oart of the G component) in 40 years which dragged down the government component to -1.33%. In a balance sheet recession, the government component is crucial as it helps provide the income that the de-leveraging consumer can spend while paying down debt.
All in all, the economy remains incredibly fragile. The good news is that the deficit isn’t expected to decline to a large degree in 2013. BUT, the debt ceiling debates linger and the risk is a large cuts that would drive this data deeper into the red and into a certain recessionary environment. I don’t think the headline figure is worth panicking over, but it highlights the importance of the government component in this economic environment. And it shows why the debt ceiling debates will likely steer the economy in 2013.
(Figure 1 – GDP by component contribution via Orcam Group)
Mr. Roche is the Founder and Chief Investment Officer of Discipline Funds.Discipline Funds is a low fee financial advisory firm with a focus on helping people be more disciplined with their finances.
He is also the author of Pragmatic Capitalism: What Every Investor Needs to Understand About Money and Finance, Understanding the Modern Monetary System and Understanding Modern Portfolio Construction.


Comments are closed.