
I hope to live to 75. HOPE. I plan to have really LIVED long before I turn 75. Thing is, I’m already on the back 9 of my life expectancy. And I like to think that many of my biggest expenses are still ahead of me. I’ve planned for the future. I’ve been prudent. But I have to constantly ask myself – how long is my relevant investing time horizon? It’s certainly not 100 years. It’s most likely not 50 years. If it’s 30 years then I sure hope it’s wheelchair accessible. Maybe it’s 20 years? But most of the things I worry about are going to happen in the next 5-10 years. That is, my realistic investing time horizon is actually fairly medium term. Like most people, it’s probably in the 5-10 year time horizon for much of my assets. Yes, part of my assets can be set aside for very long-term purposes. But much of it is also necessarily short-term. When you blend all of that I think our total portfolios are comprised of something that’s more medium term.
But here’s the thing about the world of finance. We seem to have evolved from being obsessed with the very short-term as we all became day traders in the 1990’s to now becoming obsessed with the very long-term. It seems like every day I read some new article about how everyone is suddenly investing for the next 30+ years. Except, we all know that when the market crashes again most of these “long-term” investors are going to realize that they’re actually not that comfortable with having their savings exposed to that sort of volatility. And they’ll likely become something less long-term than they thought they were.
So, I have to wonder – how is a chart like the one below (with data based on a 144 year period) even remotely relevant to anything in my life? It might as well date back to the Jurassic Period. After all, I don’t know the first thing about 1871 (except that the first human cannonball, Emilio Onra, was shot – just kidding, I had no idea that was done in 1871, but it seems pretty amazing). 1871 was 144 years ago! The total returns of the stock market over a 144 year period are almost certainly irrelevant to every living person’s life. Yes, I get the point. We should try to think long-term. I know. We should reduce fees. I know. We should reduce taxes. I know all of that. But I also want a financial plan that actually reflects my life – the one I am LIVING and not the one some academic is theorizing about. I don’t need a group of robots telling me that I am an idiot for worrying about my finances in the next 5-10 years. So please, stop showing us charts of the stock market going back to 1871. We all know the purpose of these charts. But we also know, intuitively, that they’re far less useful than some people would have us think.
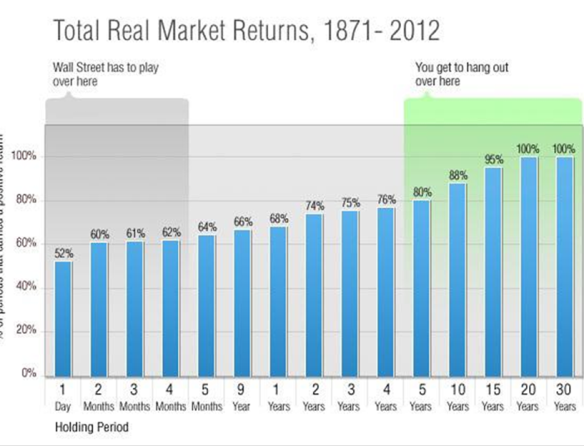
(This chart is from a Bob Seawright post, which, as usual, was excellent and you should go read)
Related:
Mr. Roche is the Founder and Chief Investment Officer of Discipline Funds.Discipline Funds is a low fee financial advisory firm with a focus on helping people be more disciplined with their finances.
He is also the author of Pragmatic Capitalism: What Every Investor Needs to Understand About Money and Finance, Understanding the Modern Monetary System and Understanding Modern Portfolio Construction.