In a recent story, Matt Yglesias takes issue with the “myth-making” idea that the recession was essentially the same thing as the housing collapse. He says:
“But the chart also shows us that contrary to a lot of myth-making, the recession is not identical to the downturn in housing. Residential construction peaked way back in 2006, but for about two years the declines in housing were offset by increased imports. That’s a window into a happier alternative history of the housing boom in which the same process just continued. The construction industry collapses and workers shift out of homebuilding into import-competing and exporting occupations. Living standards sort of stagnate awhile because growing net exports means “making more stuff without consuming more stuff” but there’s no mass unemployment. After several years of growth in net exports, households and firms have deleveraged a fair amount and we can go back to building houses. But instead, that happy saga was interrupted by the great crash of 2008, which pulled business investment and exports down with it.”
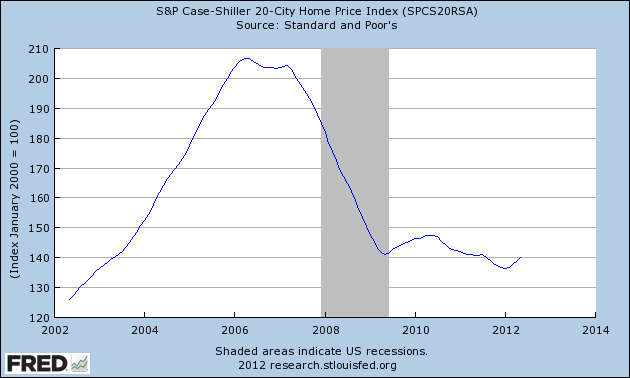
There were a lot of moving parts in the 2006-2008 period (for instance, the trade weighted USD rallied 35%+ in these two years!), but none was more destructive than the persistent decline in home prices. As you can see below, home prices didn’t even start to accelerate to the downside until 2007. THIS was the tipping point. Actually, “tipping point” is the wrong terminology because this downturn was a process. Just like the boom was a process, so was the bust. It was not an event despite having the appearance of being one. Anyone who was paying attention, for instance, to corporate earnings in various sectors during the 2006-2008 period can vividly remember the dominoes falling. First housing, then commercial, then financials, then consumer discretionary, etc. The balance sheet deterioration was not an event. It was a process that slowly filtered through the economy like a horrible virus. And as the consumer’s largest asset and the most economically important component of the debt markets began to decline in value balance sheets all over the place were impacted. And as the snowball picked up momentum the damage increased. The fact that it fell off a cliff in 2008 doesn’t mean it wasn’t rolling for years before that….
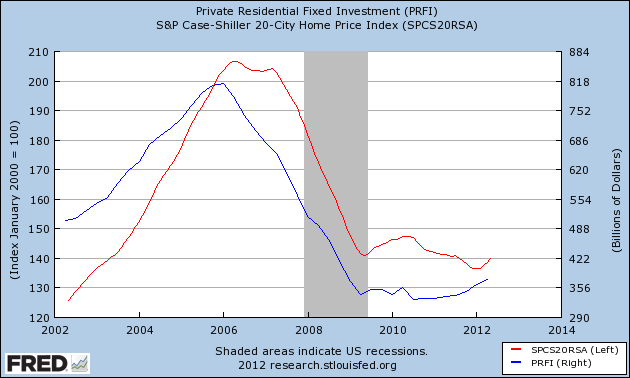
Update – I’ve updated the post with a chart below showing private residential fixed investment and the Case Shiller home price index. They actually peaked within months of one another so the implication that PRFI and home prices were substantially disjointed is just flat out wrong….The home price decline was occurring in unison, but didn’t pick up real momentum until later in 2007. This then filtered through the financial system with insolvencies, defaults, personal bankruptcies and foreclosures all slowly gaining momentum. This all culminated in what appeared like a banking collapse as the customers of banks slowly became insolvent (or less solvent than previously presumed) which further rippled through the asset backed markets and imploded bank balance sheets which had been levered up on the idea that housing prices couldn’t go down. It all goes back to the housing boom and the bust….If you don’t believe me just ask anyone at any of the major banks who understands why Lehman went bankrupt and caused the biggest credit crisis in 80 years. They’ll tell you that their assets collapsed when the residential mortgage market collapsed which led directly to the credit crisis and the surge in unemployment and collapse in GDP.
Mr. Roche is the Founder and Chief Investment Officer of Discipline Funds.Discipline Funds is a low fee financial advisory firm with a focus on helping people be more disciplined with their finances.
He is also the author of Pragmatic Capitalism: What Every Investor Needs to Understand About Money and Finance, Understanding the Modern Monetary System and Understanding Modern Portfolio Construction.


Comments are closed.