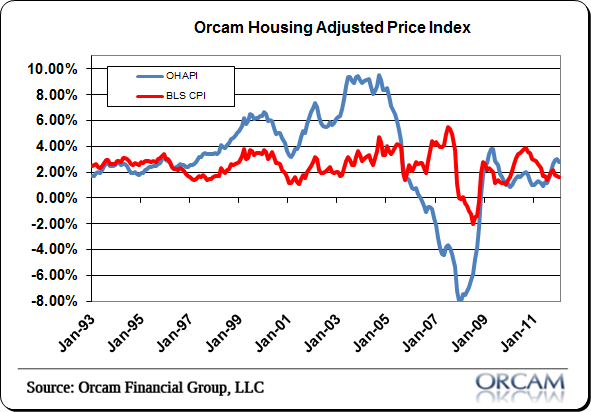
This morning’s CPI figure from the BLS showed another decline in the annual rate of change for consumer prices. Prices rose just 1.6% year over year at the headline rate while core inflation rate was 1.9% (ex-food and energy).
It might help to put some of this data into perspective. First of all, the CPI is being weighed on by the transportation portion of the index. This is heavily influenced by energy which was down 1.7% this month. This is likely to change in the quarters going forward as the year over year comps will begin to reflect substantial declines in gas prices in Q2 2012.
My other concern about the low stated rate of inflation is the improvement in housing. Housing’s depression has been a hugely deflationary force for the broader economy. That has shifted to a more inflationary position. I adjust the CPI to reflect for this change in the Orcam Housing Adjusted Price Index which you’ll see below. The current divergence is growing substantial as the OHAPI shows a 2.8% year over year increase and the CPI data shows just a 1.6% change. The BLS reports housing at just a 1.8% year over year change while broader home price indices are reporting as high as 8% year over year changes. I think consumers are much more likely feeling something closer to the OHAPI than the CPI data. At worst, the core inflation rate of 1.9% much more accurately represents actual prices.
Going forward, I would expect upward pressure on prices. Housing will likely continue to flow through at a positive rate of change and energy prices will continue to have their broad influence on the index with comps becoming much easier in the quarters ahead. Given the unusual seasonal strength in energy prices this year we’re likely to see higher prices this summer though that might not be reflected in the CPI data for another quarter or so.
Mr. Roche is the Founder and Chief Investment Officer of Discipline Funds.Discipline Funds is a low fee financial advisory firm with a focus on helping people be more disciplined with their finances.
He is also the author of Pragmatic Capitalism: What Every Investor Needs to Understand About Money and Finance, Understanding the Modern Monetary System and Understanding Modern Portfolio Construction.


Comments are closed.