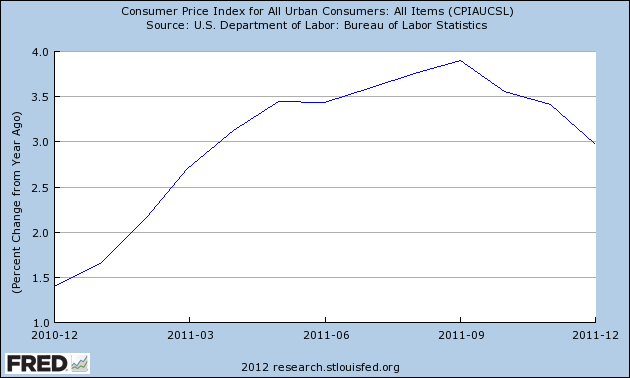
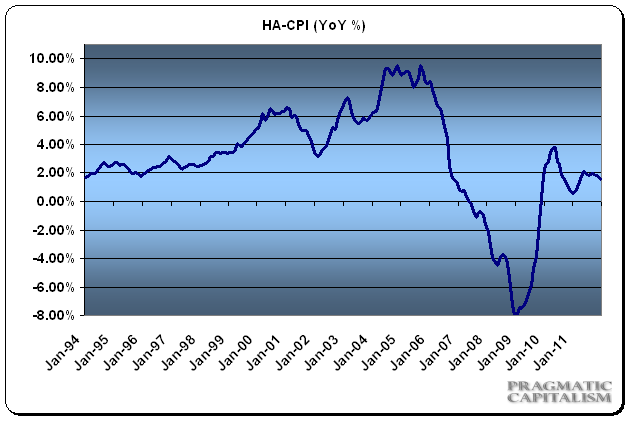
This morning’s inflation data showed signs of a trend I started predicting back in September of last year – the return of disinflation. Disinflation is a decline in the annual rate of inflation. So, we’re still seeing positive inflation figures, but the annualized rate is on the decline. That’s reflected in general economic weakness and a substantial decline in many commodity prices. Econoday offers some specifics on this morning’s data:
“Consumer price inflation was nonexistent in December at the headline and core levels. The consumer price index in December was unchanged for the second month in a row with lower energy costs playing a key role. The December figure was lower than market expectations for a 0.1 percent rise. Excluding food and energy, the CPI decelerated to a modest 0.1 percent increase after gaining 0.2 percent in November. Market expectations were for a 0.1 percent rise.
By major components, energy dipped 1.3 percent after declining 1.6 percent in November. Gasoline fell 2.0 percent, following a 2.4 percent decline in November. Food price inflation firmed to 0.2 percent after rising 0.1 percent the prior month.
Within the core, upward pressure was seen in medical care, recreation, and rent. Declines were seen in used cars & trucks, new vehicles, and apparel.
Year-on-year, overall CPI inflation posted at 3.0 percent, compared to 3.4 percent in November (seasonally adjusted). The core rate edged held steady at 2.2 percent on a year-ago basis. On an unadjusted year-ago basis, the headline number was up 3.0 percent in November versus 3.4 percent in November. The core was up 2.2 percent, matching November’s rate.”

My housing adjusted CPI, which I believe better adjusts for the housing component in the CPI (for instance, the BLS measure showed ZERO housing deflation from 2006-2010) is now showing a 1.6% YoY reading. The discrepancy between this indicator and the BLS data is reflected in the continued declines in national home prices. As I previously mentioned, this disinflation trend is likely to persist through the first quarter of 2012.

Mr. Roche is the Founder and Chief Investment Officer of Discipline Funds.Discipline Funds is a low fee financial advisory firm with a focus on helping people be more disciplined with their finances.
He is also the author of Pragmatic Capitalism: What Every Investor Needs to Understand About Money and Finance, Understanding the Modern Monetary System and Understanding Modern Portfolio Construction.

Comments are closed.