Alright, nerds. It’s time to put on our thinking caps and fill up our pocket protectors. We’re gonna talk about inverted yield curves.
First things first – What is an inverted yield curve?
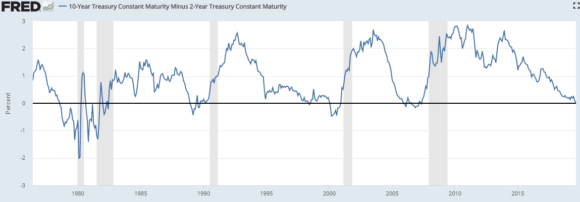
An inverted yield curve is a description of the comparison between 10 year Treasury note yields and 2 year treasury note yields. Those are the only two instruments that matter here. If anyone else says an inverted curve is some version of some other set of instruments then take away their nerd badge. They’re out of the club. So, for instance, if the 10 year is yielding 2% and the 2 year is yielding 2.5% then the curve is inverted by 0.5%. Here’s a current picture:

Inversions are weird because the curve should normally shift upwards. Short maturities should yield lower amounts than longer maturities because investors will typically hedge the risk that the rate of inflation will be higher than short rates in the future thereby commanding a premium for the risk.
This brings me to interest rate basics. What really drives interest rates? Well, the 2 year is essentially a Federal Reserve controlled note. The Fed has precise control over short-term rates because it is the monopoly supplier of reserves to the banking system and it sets the interest rate on reserves. But the Fed sets short rates by trying to guess what inflation will be in the future. But they don’t control long rates precisely because they let them float. So the long rate is controlled mainly by bond traders who are trying to guess what the Fed will do next which is an indirect guess about what inflation will do next. It might be helpful to think of the Fed like they’re walking a poorly trained dog on a long leash. They control the leash precisely at the short end and less so at the long end, but the control at the short end is based on how well they can guess where the dog is pulling them in the future. So, they appear to be walking the dog, but the dog really walks them to a large degree.
Now for the good stuff. Are inverted curves scary? This is a question without a clean answer. On the one hand, the curve has inverted before virtually every post-war recession and the Fed takes it seriously as an indicator of economic health.¹ On the other hand, the evidence outside of the USA is somewhat mixed.² Personally, I think it’s better to think of the yield curve for what it is – a relative view of inflation. So, when the short end is higher than the long end then the Fed is basically saying they see higher risk of inflation than bond traders see. And since the 2 year yield is usually somewhat low to begin with then the inverting curve is an indicator that inflation is declining and economic growth is softening. It’s just a market price that reflects softening economic expectations.
Importantly, it’s unhelpful to view the yield curve as some sort of on/off switch. The economy isn’t screwed just because the curve inverts. Again, it’s a relative measure so it’s better to view it as an indication that economic growth is slowing relative to what it has been. So, going back to our previous analogy, you can think of the inverted curve as a situation where the dog is slowing down and you’re moving closer to it. This might spell the end of your walk, or just a slowdown in the pace of your walk, but it doesn’t mean the dog is going to keel over or anything. Further, according to my friend Urban Carmel a recession doesn’t even happen for 19 months on average after the curve inverts and the S&P 500 actually peaks a year after the curve inverts. So, we might be in the 9th inning, but there are runs to be scored here.³
Lastly, it’s important to keep things in perspective here because the term premium, the relative difference between long and short rates has compressed over the last 20 years so it doesn’t take much to cause an inversion. So you have an environment here where short rates were at 0%, barely got off the mat, and now are falling again. The global economy is still like a boxer who got knocked out, got to one knee, and now looks like they might or might not fall over again. Sure, it’s scary to fall back down, but falling from one knee isn’t nearly as scary as falling from your feet. And that’s basically what the yield curve currently represents. So, I wouldn’t get too worked up about it just yet.4
¹ – See, Economic Forecasts with the Yield Curve
² – See, The Predictive Power of the Yield Curve Across Countries and Time
³ – Speaking of runs scored – did you catch that Nats game yesterday?
4 – It’s true, I wrote a version of this same article downplaying yield curve inversions in 2017. I was right then. So, even if I am wrong this time then I am still batting 500. Not bad if you ask me.
Mr. Roche is the Founder and Chief Investment Officer of Discipline Funds.Discipline Funds is a low fee financial advisory firm with a focus on helping people be more disciplined with their finances.
He is also the author of Pragmatic Capitalism: What Every Investor Needs to Understand About Money and Finance, Understanding the Modern Monetary System and Understanding Modern Portfolio Construction.

