
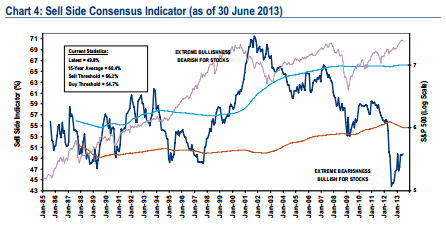
What if I told you sentiment was still broadly negative with regards to the future of the economy and the market in general. Would you really be that surprised? You’ve probably seen this chart from Merrill Lynch showing the Wall Street consensus equity allocation, but I figured I’d provide a brief update here (via ML):
- Wall Street’s consensus equity allocation has been a reliable contrary indicator over time. In other words, it has been a bullish signal when Wall Street strategists were extremely bearish, and vice versa.
- Despite the rebound since hitting an all-time low of 43.9 in July 2012 (based on data since 1985), strategists’ bearishness on equities remains extremely depressed relative to history. At 49.8, the indicator remains firmly in “Buy” territory.
- Even though the S&P 500 has already risen 22% since sentiment bottomed, historical returns have also been very robust in the subsequent 12 and 24 months after the indicator troughed, averaging 24% and 46%, respectively (Table 4).
- Historically, when the indicator has been below 50, total returns over the subsequent 12 months have been positive 100% of the time. Current bearish sentiment suggests +22% 12-month price returns.
Mr. Roche is the Founder and Chief Investment Officer of Discipline Funds.Discipline Funds is a low fee financial advisory firm with a focus on helping people be more disciplined with their finances.
He is also the author of Pragmatic Capitalism: What Every Investor Needs to Understand About Money and Finance, Understanding the Modern Monetary System and Understanding Modern Portfolio Construction.
Comments are closed.