

I always love this post that Business Insider puts together on the best charts in the world. They gather great insights from many of Wall Street’s best analysts. I didn’t contribute anything this time around because my schedule didn’t permit, but I did review the other charts and they’re as good as always. Probably better overall quality after having removed my contribution from the usual set.
That said, three of the charts really jumped out at me:
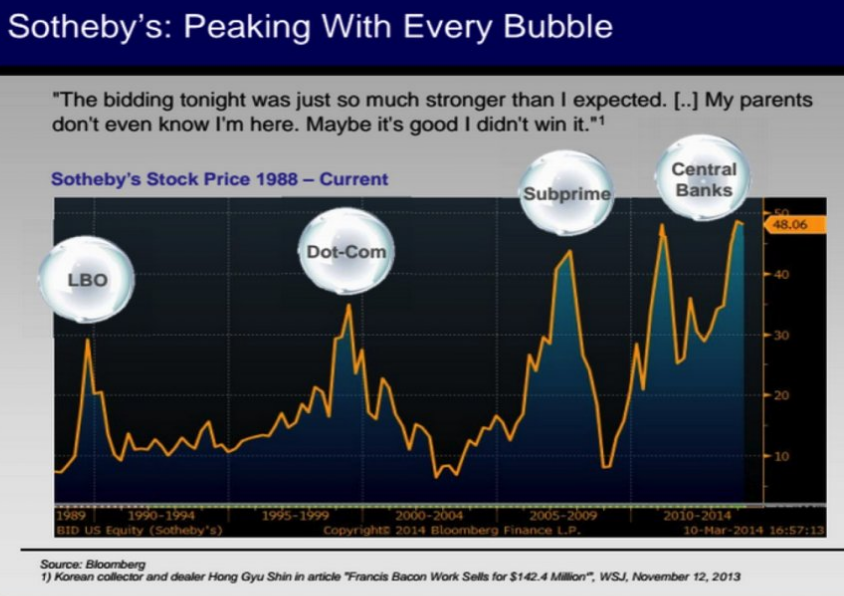
Will This be Remembered as the “Fed Bubble”?
This chart via Jim Chanos of Kynikos Associates notes the correlation between Sothetby’s stock price and asset bubbles. These manias have tended to coincide with periods where Sothetby’s, an auction house generally selling luxury goods, as been booming. It makes sense then that irrational exuberance would be accompanied by frivolous spending on luxury items….
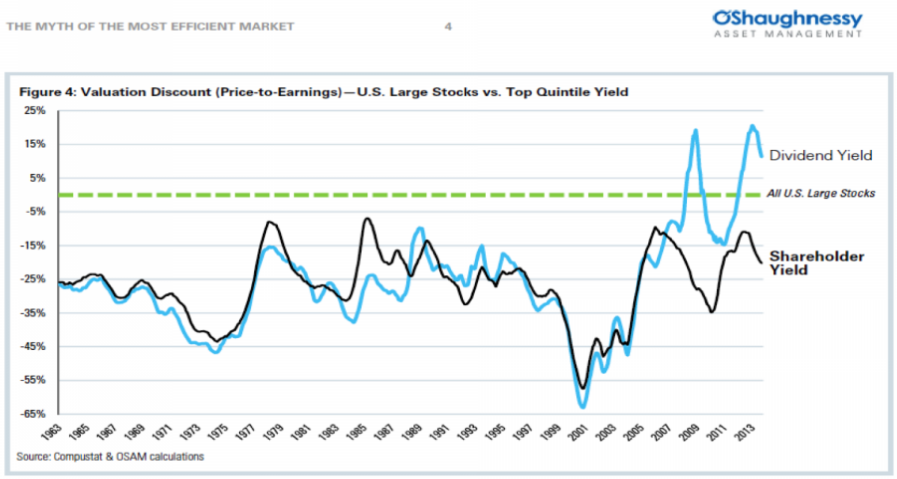
Beware the Dividend Chase?
Meb Faber of Cambria highlighted a piece from Patrick O’Shaughnessy which points out that dividend stocks are trading at a very high historical premium. This is obviously related to chart 1 where the Fed has forced investors out of interest bearing assets and into cash which has forced a reach for yield. The result is this disequilibrium we’re seeing in what are normally very safe and secure equity instruments.
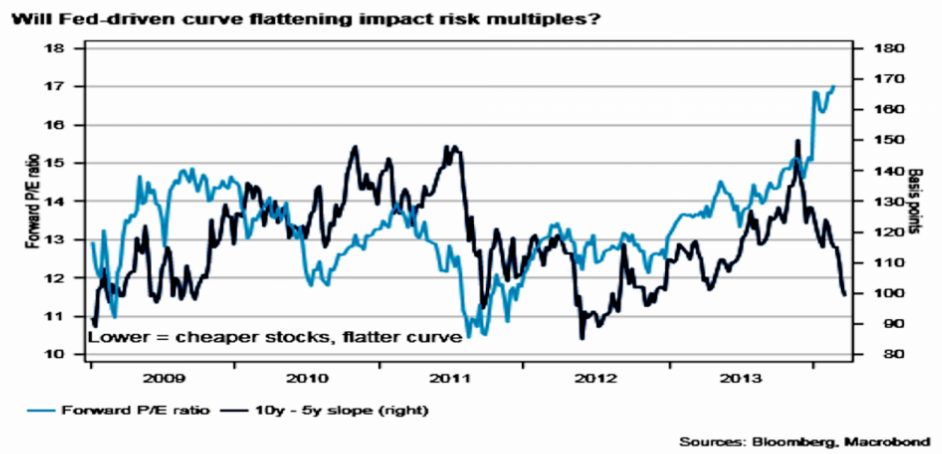
Will Fed-Driven Curve Flattening Impact Risk Multiples?
The final chart is from Martin Enlund at Handelsbanken Capital Markets. Martin highlights the divergence between the slope of the 10y-5y curve in the bond market relative to P/E ratios on equities. The bond market is sending a very clear message – growth will be weak. Equities on the other hand, reflect an increasing reach for risk and higher prices despite the warnings from the bond market.
Mr. Roche is the Founder and Chief Investment Officer of Discipline Funds.Discipline Funds is a low fee financial advisory firm with a focus on helping people be more disciplined with their finances.
He is also the author of Pragmatic Capitalism: What Every Investor Needs to Understand About Money and Finance, Understanding the Modern Monetary System and Understanding Modern Portfolio Construction.
Comments are closed.