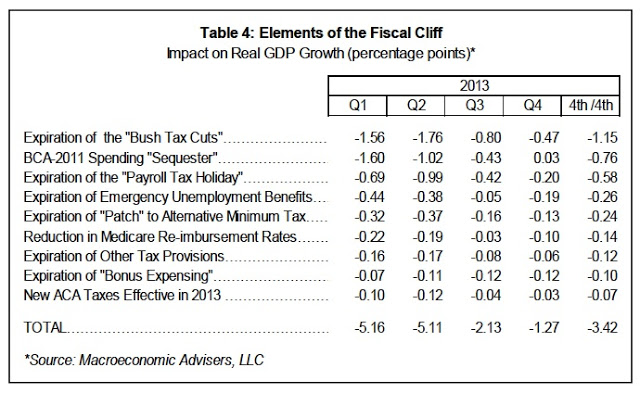
Just in case you haven’t gotten enough of the fiscal cliff…here’s a nice breakdown by policy and its impact on 2013 GDP by quarter via Macroeconomic Advisors:
We’re often asked how much of a drag on growth is associated with each of the provisions of current law that usually are described as comprising the fiscal cliff. The table below presents such results for the four quarters of 2013 and the year as a whole in descending order of importance. These simulations were generated with MA/US, our recently updated macro model, assuming the model’s endogenous monetary offset but holding oil prices along the baseline path and making no judgmental adjustments in the model to other financial conditions.
Each provision was simulated separately, so the total reported in the table excludes interaction effects between the provisions. The largest two items are — not surprisingly — the expiration of the Bush tax cuts (-1.15 percentage points of GDP growth over the year) and the spending sequester (-0.76 percentage point of GDP growth). At the bottom of the list, the new taxes enacted as part of the Affordable Care Act will subtract less than one-tenth of a percentage point from growth over 2013.
In total, the maximum potential hit to growth from the fiscal contraction is 3.4 percentage points over the entire year, but more than 5 percentage points in the first half of the year. Our baseline forecast includes roughly 11/4 percentage points of the total possible hit to growth.
Mr. Roche is the Founder and Chief Investment Officer of Discipline Funds.Discipline Funds is a low fee financial advisory firm with a focus on helping people be more disciplined with their finances.
He is also the author of Pragmatic Capitalism: What Every Investor Needs to Understand About Money and Finance, Understanding the Modern Monetary System and Understanding Modern Portfolio Construction.


Comments are closed.