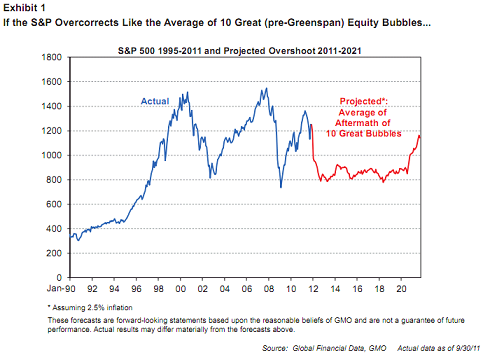
In his latest quarterly letter Jeremy Grantham provides some broad thoughts. The most interesting of which is his projection for how the S&P 500 might perform given the history of past bubbles. Mr. Grantham’s findings are not pretty:
“No Market for Young Men.” Historians would notice that all major equity bubbles (like those in the U.S. in
1929 and 1965 and in Japan in 1989) broke way below trend line values and stayed there for years. Greenspan, neurotic about slight economic declines while at the same time coasting on Volcker’s good work, introduced an era of effective overstimulation of markets that resulted in 20 years of overpriced markets and abnormally high profit margins. In this, Greenspan has been aided by Bernanke, his acolyte, who has continued his dangerous policy. The first of the two great bubbles that broke on their watch did not reach trend at all in 2002, and the second, in 2009 – known by us as the fi rst truly global bubble – took only three months to recover to trend. This pattern is unique. Now, with wounded balance sheets, perhaps the arsenal is empty and the next bust may well be like the old days. GMO has looked at the 10 biggest bubbles of the pre-2000 era and has calculated that it typically takes 14 years to recover to the old trend. An important point here is that almost no current investors have experienced this more typical 1970’s-type market setback. When one of these old fashioned but typical declines occurs, professional investors, conditioned by our more recent ephemeral bear markets, will have a permanent built-in expectation of an imminent recovery that will not come. For the record, Exhibit 1 shows what the S&P 500 might look like from today if it followed the average fl ight path of the 10 burst bubbles described above. Not very pretty.

His recommendations to deal with what he calls “7 lean years”:
Recommendations
- Avoid lower quality U.S. stocks but otherwise have a near normal weight in global equities.
- Tilt, where possible, to safety.
- Try to avoid duration risk in bonds. For the long term they are desperately unattractive. Don’t be too proud (orshort-term greedy) to have substantial cash reserves. Admittedly, this is the point where we at GMO try to be clever and do a little better than the minus 1% real from real cash – and, so far, with decent success.
- I like (personally) resources in the ground on a 10-year horizon, but I am nibbling in very slowly because, as per my Quarterly Letter on resources in April 2011, I fear a major short-term decline in commodities based on a combination of less bad weather – which has been bad, but indeed less bad – and economic weakness, especially in China. Prices have declined, often quite substantially, since that letter. However, I believe chances for further price declines in resources are still better than 50/50 as China and the world slow down for a while, and the weather becomes a bit more stable.
Source: GMO
Mr. Roche is the Founder and Chief Investment Officer of Discipline Funds.Discipline Funds is a low fee financial advisory firm with a focus on helping people be more disciplined with their finances.
He is also the author of Pragmatic Capitalism: What Every Investor Needs to Understand About Money and Finance, Understanding the Modern Monetary System and Understanding Modern Portfolio Construction.

Comments are closed.