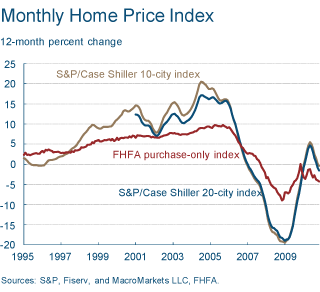
The Cleveland Fed helps put the current housing decline in perspective:
“The S&P/Case-Shiller Monthly House Price Index took a step backward in the three months ending in November, with the 10-city and 20-city composite indexes falling 0.4 percent and 0.5 percent, respectively. November’s report marks the indexes’ fifth consecutive decline, pushing year-over-year growth in the 10-city index negative for the first time since January, to −0.4 percent. The 20-city index fared even worse, slipping 1.6 percent below its year-ago level. Declines were geographically broad-based, with only four metro areas showing year-over-year price growth—Los Angeles, San Diego, San Francisco, and Washington, D.C.
The monthly FHFA house price index was flat from October to November after having declined four months in-a-row. This recent activity, of course, has not helped bolster year-over-year growth, which dropped another 0.3 percentage point to −4.3 percent in November. Deterioration in the FHFA index since April 2007 has essentially set home prices back to where they were in early 2004.”

Mr. Roche is the Founder and Chief Investment Officer of Discipline Funds.Discipline Funds is a low fee financial advisory firm with a focus on helping people be more disciplined with their finances.
He is also the author of Pragmatic Capitalism: What Every Investor Needs to Understand About Money and Finance, Understanding the Modern Monetary System and Understanding Modern Portfolio Construction.

Comments are closed.