
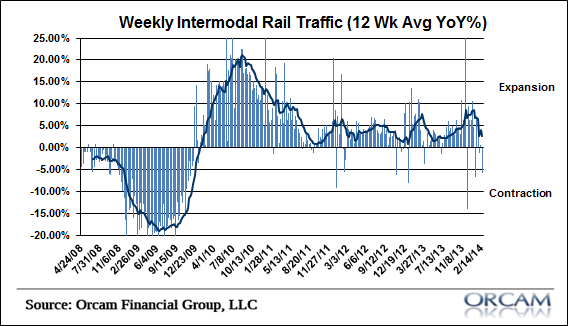
The latest reading on rail traffic is showing some fairly substantial softening. The weekly reading in intermodal traffic came in at -5.7% which brings the 12 week moving average to just 1.7%. That’s the weakest reading since the middle of last year. On the whole, this is much more consistent with the muddle through economic environment we’ve been seeing.
“The Association of American Railroads (AAR) today reported decreased U.S. rail traffic for the week ending Feb. 15, 2014 with 270,632 total U.S. carloads, down 2.9 percent compared with the same week last year. Total U.S. weekly intermodal volume was 236,625 units down 5.7 percent compared with the same week last year. Total combined U.S. weekly rail traffic was 507,257 carloads and intermodal units, down 4.3 percent compared with the same week last year.
Two of the 10 carload commodity groups posted increases compared with the same week in 2013, including petroleum and petroleum products with 14,234 carloads, up 7.9 percent; and grain with 19,137 carloads, up 2.5 percent. Commodities showing a decrease compared with the same week last year included nonmetallic minerals and products with 26,660 carloads, down 10.6 percent.
For the first seven weeks of 2014, U.S. railroads reported cumulative volume of 1,877,070 carloads, down 0.8 percent from the same point last year, and 1,666,024 intermodal units, up 0.1 percent from last year. Total combined U.S. traffic for the first seven weeks of 2014 was 3,543,094 carloads and intermodal units, down 0.4 percent from last year.”
Mr. Roche is the Founder and Chief Investment Officer of Discipline Funds.Discipline Funds is a low fee financial advisory firm with a focus on helping people be more disciplined with their finances.
He is also the author of Pragmatic Capitalism: What Every Investor Needs to Understand About Money and Finance, Understanding the Modern Monetary System and Understanding Modern Portfolio Construction.
Comments are closed.