
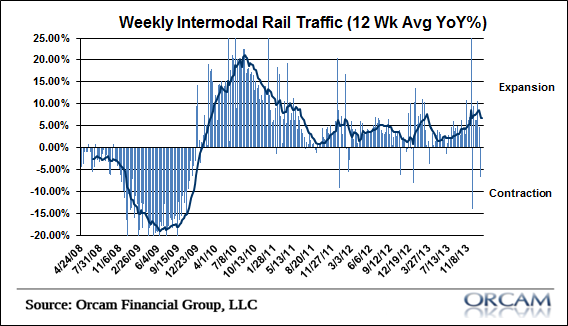
Rail traffic fell in the second week of the year with intermodal recording a -6.7% reading. This was the worst reading since early December. This brought the 12 week moving average to 6.77%.
Here’s more details via AAR:
“The Association of American Railroads (AAR) today reported decreased U.S. rail traffic for the week ending Jan. 11, 2014 with 256,849 total U.S. carloads, down 8.2 percent compared with the same week last year. Total U.S. weekly intermodal volume was 235,987 units down 6.7 percent compared with the same week last year. Total combined U.S. weekly rail traffic was 492,836 carloads and intermodal units, down 7.5 percent compared with the same week last year.Two of the 10 carload commodity groups posted increases compared with the same week in 2013, including grain with 20,367 carloads, up 10.1 percent. Commodities showing a decrease compared with the same week last year included motor vehicles and parts with 11,051 carloads, down 22.5 percent; metallic ores and metals with 20,143 carloads, down 20.3 percent; and, nonmetallic minerals and products with 25,177 carloads, down 16.0 percent.For the first two weeks of 2014, U.S. railroads reported cumulative volume of 503,695 carloads, down 3.4 percent from the same point last year, and 422,865 intermodal units, down 1.9 percent from last year. Total combined U.S. traffic for the first two weeks of 2014 was 926,560 carloads and intermodal units, down 2.8 percent from last year.”
Mr. Roche is the Founder and Chief Investment Officer of Discipline Funds.Discipline Funds is a low fee financial advisory firm with a focus on helping people be more disciplined with their finances.
He is also the author of Pragmatic Capitalism: What Every Investor Needs to Understand About Money and Finance, Understanding the Modern Monetary System and Understanding Modern Portfolio Construction.
Comments are closed.