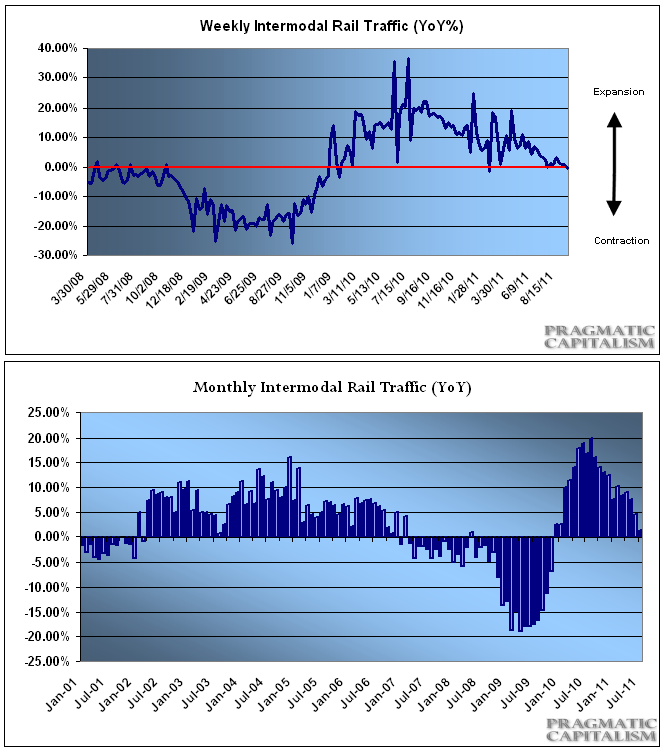
After a persistent steady year over year climb in weekly rail traffic trends, the data has finally succumbed to the weakening economy and turned negative. While this is only a one week trend it is worth keeping an eye on the trend. Recent data has been positive, but persistently weak. The last time the monthly data turned negative was January 2007 before the economy began slipping into a deep recession. Charts have been attached below.
The AAR elaborates on this week’s data.
“The Association of American Railroads (AAR) today reported a slight dip in weekly rail traffic, with U.S. railroads originating 299,943 carloads for the week ending August 27, 2011, down 0.8 percent compared with the same week last year. Intermodal volume for the week totaled 236,051 trailers and containers, down 0.5 percent compared with the same week last year.
Eleven of the 20 carload commodity groups posted increases from the comparable week in 2010, including: metallic ores, up 26.1 percent; iron and steel scrap, up 20.2 percent; and motor vehicles and equipment, up 13.2 percent. Groups showing a decrease in weekly traffic included: waste and nonferrous scrap, down 21.1 percent; farm products excluding grain, down 20.5 percent; and grain, down 17 percent.
Weekly carload volume on Eastern railroads was down 1.2 percent compared with the same week last year. In the West, weekly carload volume was down 0.6 percent compared with the same week in 2010.
For the first 34 weeks of 2011, U.S. railroads reported cumulative volume of 9,830,960 carloads, up 1.9 percent from the same point last year, and 7,697,679 trailers and containers, up 6.1 percent from last year.”

Mr. Roche is the Founder and Chief Investment Officer of Discipline Funds.Discipline Funds is a low fee financial advisory firm with a focus on helping people be more disciplined with their finances.
He is also the author of Pragmatic Capitalism: What Every Investor Needs to Understand About Money and Finance, Understanding the Modern Monetary System and Understanding Modern Portfolio Construction.

Comments are closed.