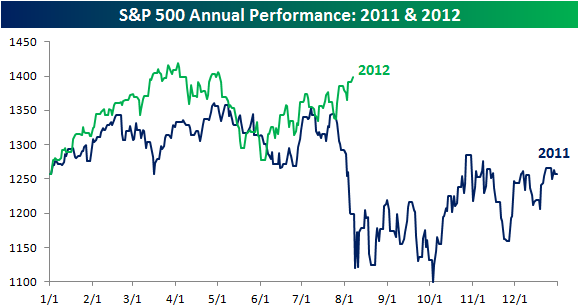
I’ll make this brief. I hate the chart below. It shows a comparison of 2011 vs 2012. The implication is simple – since the market performed in a certain way in 2011 and this performance somehow correlates with the first 7 months of 2012 then that must mean it’s somehow useful in deciphering how the rest of this year might play out. There are a lot of problems with this sort of analysis, but the most blatant issue is that it’s a horrid case of recency bias. Let me explain.
I once had a friend in college who said that he had devised a winning strategy for gambling. He was a major in some sort of environmental studies so give him a break here. Anyhow, he said if you could count the number of spins at a roulette wheel over a long number of spins and find out when the spins became uneven (for instance, 60 blacks vs 40 reds) that you could establish a winning percentage going forward by assuming that the wheel will generate a 50/50 split over the long-term. Hence, because the wheel has recently been spinning black, it now makes more sense to bet on red. But each spin at a roulette wheel is a totally new and independent event. The odds are always 50/50 (well, not exactly thanks to those sneaky casino bastards who throw the single or double red slot in there!). So each spin has the same odds and past spins have zero impact on future spins. This is a case of recency bias that often plagues stock market investors.
While the equity market is not 100% independent of past events, each new year in the equity markets is impacted by totally new events that are largely independent of past events. The past might rhyme, but it doesn’t just repeat. Yes, there are trends in place (some longer than others), but don’t be fooled into believing that you can predict the future purely by looking at the past. I prefer to use technical analysis and charting tools as a supplement to a good fundamental understanding of current and future events. Remember, you have think like a chess player. And while it might benefit the chess player to understand past history, he becomes a winner by understanding potential future moves. Not merely looking at the past and expecting his opponents to repeat prior moves.
(chart courtesy of Bespoke Investments)
Mr. Roche is the Founder and Chief Investment Officer of Discipline Funds.Discipline Funds is a low fee financial advisory firm with a focus on helping people be more disciplined with their finances.
He is also the author of Pragmatic Capitalism: What Every Investor Needs to Understand About Money and Finance, Understanding the Modern Monetary System and Understanding Modern Portfolio Construction.


Comments are closed.