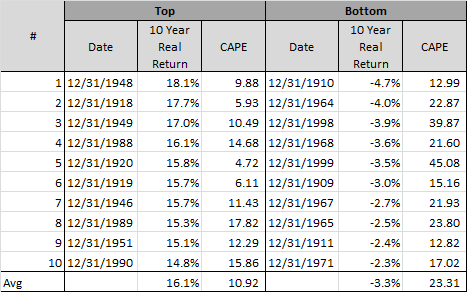
Nice graphic here from Meb Faber on the best and worst investing times. I’m not a big value guy, but do you notice the trend:
“Many of the best year starting points seem obvious in retrospect. 1948 and 1949 were good starting points, preceeding the Nifty Fifty mania, and of course 1918-1920 and the Roaring Twenties are on the list. 1988 and 1999 certainly would not be left out with the Internet bull market as well. Ditto for the bad years, they often fell at the end of massive bull runs. Notice anything about the best and worst times to invest? The average valuation (10 year CAPE) for the 10 best years was 10.92. The average valuation for the 10 worst years was 23.31, double that of the best starting points.”
Mr. Roche is the Founder and Chief Investment Officer of Discipline Funds.Discipline Funds is a low fee financial advisory firm with a focus on helping people be more disciplined with their finances.
He is also the author of Pragmatic Capitalism: What Every Investor Needs to Understand About Money and Finance, Understanding the Modern Monetary System and Understanding Modern Portfolio Construction.


Comments are closed.